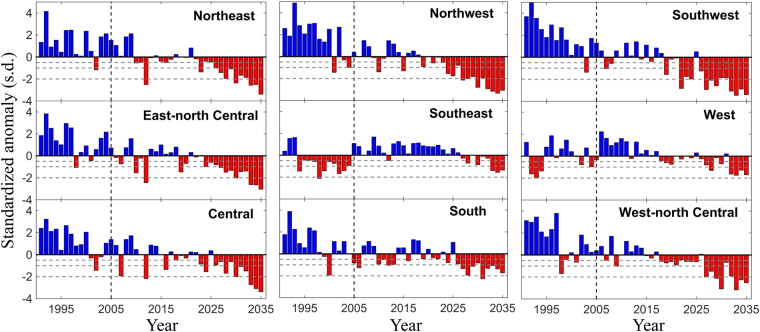
Figure 5.
Spatial trend of Standardized Anomaly of SWSI. Time series of standardized anomaly for each of the nine climatologically homogeneous regions for 45 years (1991–2035). Years that are water stressed (negative values of standardized anomaly) are shown in red. The horizontal dashed lines are drawn at −0.5, −1.0, and −2.0 Standard Deviations (SDs) to indicate three water stress levels: 0.5-, 1-, and 2-SD. The vertical line demarcates current and future time periods. Figures are generated using MATLAB 2015a (Version 8.5, http://www.mathworks.com). Finally, all these figures are organized and labelled in Adobe Photoshop CS Desktop (Version 5.1, https://www.adobe.com) [Software].

