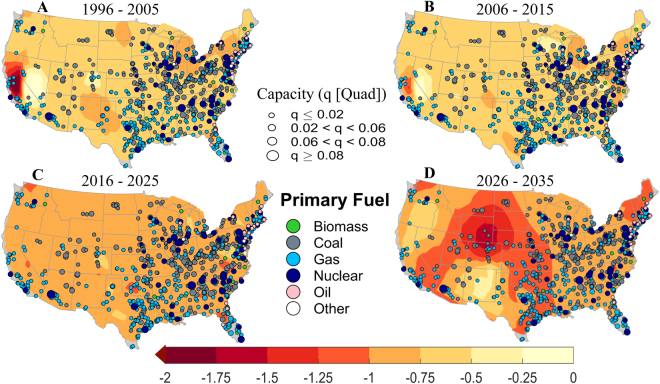
Figure 6.
Contours of standardized water stress index. (A–D) Spatial location, installed power production capacity (in Quad), and primary fuel types of thermoelectric power plants superimposed over contours of decadal mean of standardized water stress index for current (1996–2005) and future (2006–2035) time periods. Size of the filled color circle is directly proportional to the installed production capacity. Different shades of water stress contours indicate risk level due to the joint effects of low flow and high stream temperature. Grey shades in the map indicate regions where data is not available. Figures are generated using MATLAB 2015a (Version 8.5, http://www.mathworks.com). Finally, all these maps are organized and labelled in Adobe Photoshop CS Desktop (Version 5.1, https://www.adobe.com) [Software].

