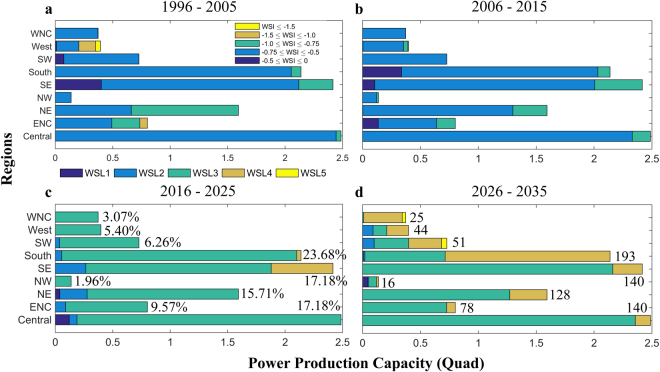
Figure 7.
Regional distribution of power production at risk under various water stress levels (WSL). (a–d) Bar plots showing the breakup of power production at risk for five different water stress risk levels over nine regions for (a) current (1996–2005) and (b–d) future (2006–2035) time periods. The annual power production capacity for each region is shown in (c). The total production capacity is 11.07 Quad (Table S3). The number of power plants in a specific region is shown in (d). The total number of power plants is 815 (Table S3). Five water stress levels (WSL) are defined as follows: WSL1 (−0.5 ≤ WSI ≤ 0), WSL2 (−0.75 ≤ WSI ≤ −0.5), WSL3 (−1.0 ≤ WSI ≤ −0.75), WSL4 (−1.5 ≤ WSI ≤ −1.0), and WSL5 (WSI ≤ −1.5), where WSI stands for water stress index. WSL1 (WSL5) indicates the less (most) severe condition. WNC: West North Central, SW: Southwest, SE: Southeast, NW: Northwest, NE: Northeast, and ENC: East North Central. Figures are generated using MATLAB 2015a (Version 8.5, http://www.mathworks.com). Finally, all these figures are organized and labelled in Adobe Photoshop CS Desktop (Version 5.1, https://www.adobe.com) [Software].

