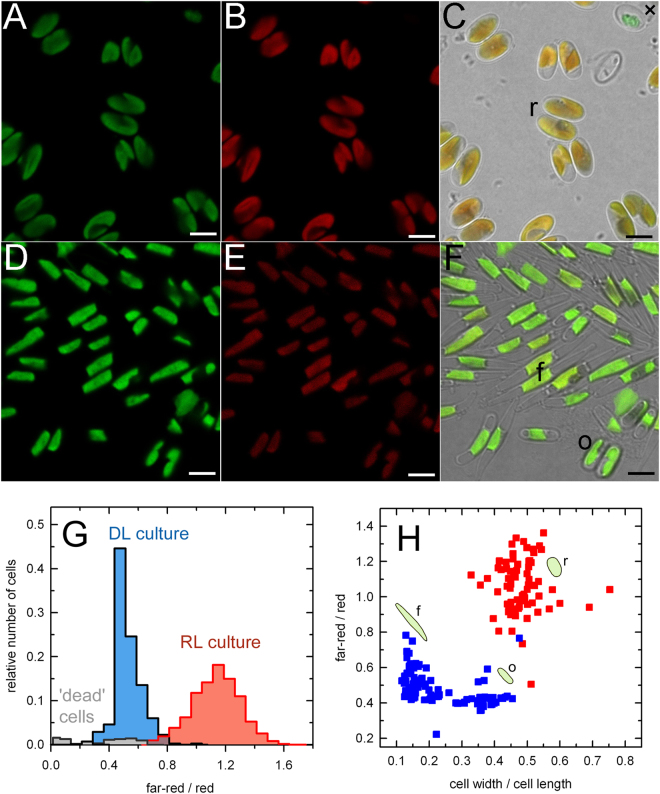
Figure 3.
Confocal microscopy image analysis of the P. tricornutum cells grown under the RL (A,B,C) and DL (D,E,F) conditions. Images showing emission signals of chlorophyll autofluorescence recorded in a dual channel setup in the wavelength ranges of red (650–696 nm) (A,D) and far-red (705–735 nm) (B,E) bands. Composite images on the right (C,F) were produced by merging of the red and far-red channels and images concurrently detected in transmitted light mode. Scale bars correspond to 5 µm. Typical examples of the cell morphotypes found in our cultures are labelled as follows: f, fusiform; o, oval; r, rounded. (G) A histogram of the far-red / red emission ratios of the DL (blue) and RL (red) culture. More than 300 individual cells from each culture condition were analyzed (see Material and Methods). The grey plot indicates aberrant, presumably dead, cells such as the one labelled with a cross (×) in panel C. Quantitative characterization of the morphological variability of the cells acclimated to the RL and DL conditions and its relationship to the spectroscopic characteristics is shown in (H). Morphotypes are indicated with cartoons and letters as in panels C and F.

