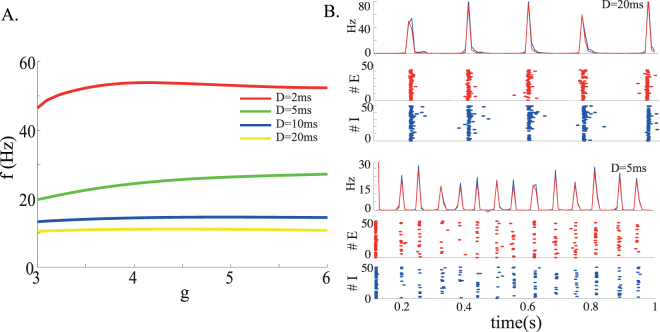
Figure 3.
(A) Frequency of the network global oscillations at the onset of the Hopf bifurcation as a function of the inhibition strength g for a network in which excitatory and inhibitory neurons have different characteristics. Longer synaptic delays give rise to slower oscillations. In this regime, the average synaptic delays are the same for excitatory and inhibitory synapses. (B) Network simulations for two different average delays. Top panels: D = 20 ms, ν X/ν θ,E = 0.78, g = 4; bottom panels: D = 5 ms, ν X/ν θ,E = 0.825, g = 5. For both parameter sets, we show the average instantaneous firing rates of excitatory (red) and inhibitory (blue) neurons, and raster plots are plotted of 50 excitatory and 50 inhibitory neurons. Other parameters: C E = 1000, J EE = 0.2 mV, J EI = 034 mV.

