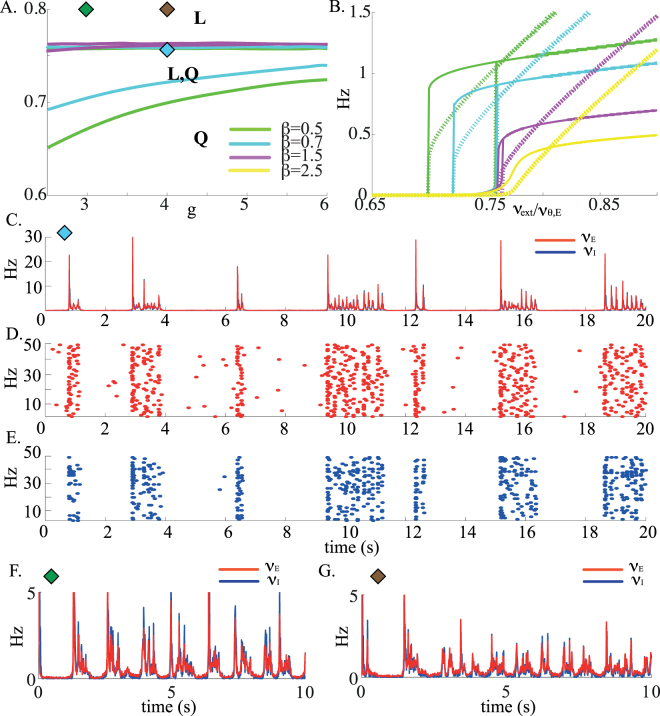
Figure 5.
Networks of LIF neurons with firing rate adaptation. (A) Mean-field: Coexistence regions between Q and L states, with increasing values of the strength of adaptation β. The coexistence region progressively shrinks and disappears at 1.5 mV.s. Diamonds indicates the location of the simulations shown in C, D, E, F and G. Parameters: C E = 1000, J EE = 0.2 mV, J EI = 0.34 mV. (B) Bifurcation diagrams (firing rates of E and I populations vs external input) for increasing values of the strength of adaptation. Solid lines: average excitatory firing rate; Dashed lines, average inhibitory firing rate. Note that the coexistence region is no longer present for β = 2.5 mV.s. (C–E) Network simulations for g = 4, ν X = 0.76ν θ,E, β = 0.7 mV.s, τ A = 200 ms, D EE = 20 ms, D II = 10 ms. (C) Average E and I firing frequency as a function of time. The population firing frequency is averaged over 10 ms time bins. Note UP and DOWN states with irregular durations of order 1 s, and instantaneous fluctuations of E and I neurons in UP states that closely track each other. (D) Raster of 50 excitatory neurons (E) Raster of 50 inhibitory neurons. (F) Network simulations for g = 3, β = 5 mV.s, τ A = 500 ms, ν X = 0.8ν θ,E. (G) Network simulations for g = 4, β = 5 mV.s, τ A = 600 ms, ν X = 0.8ν θ,E.

