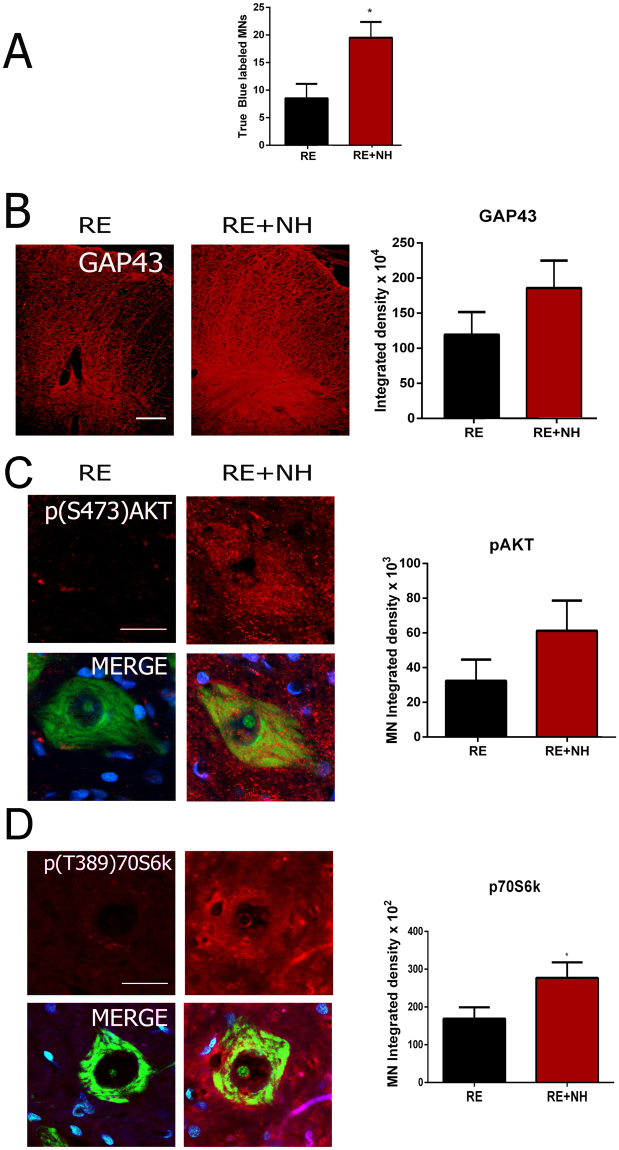
Figure 3.
Molecular markers of regeneration are modulated by NH treatment. (A) Histogram showing the average number (±SEM) of MNs labeled after intramuscular injection of True Blue into the TA and GA on the injured side. The number of positive MNs were counted in the L4-L5 segments of the spinal cords from animals at 6 months post RE for animals in RE group (not treated) or NH-treated groups (RE + NH). (B) Left, Representative microphotographs of GAP43 immunolabeling of neuronal processes at the white matter ventral horns from injured animals. Right, Bar graph of the mean immunolabeling intensity for GAP43 in a region inside the white matter from injured spinal cords. (C,D) Left, Confocal images of MNs immunolabeled for (C) phosphorylated AKT at S-473 and D) p70S6K at T-389 and counterstained with Fluoro Nissl Green and DAPI (blue) in injured spinal cord at 6 months post RE. Right, Histograms of the mean of the immunofluorescence intensity for each marker inside the cytoplasm of injured MNs (n = 4 animals, t-test, *p < 0.05 RE + NH vs. RE). Scale bar = 100 µm in B; 25 µm in C and D.

