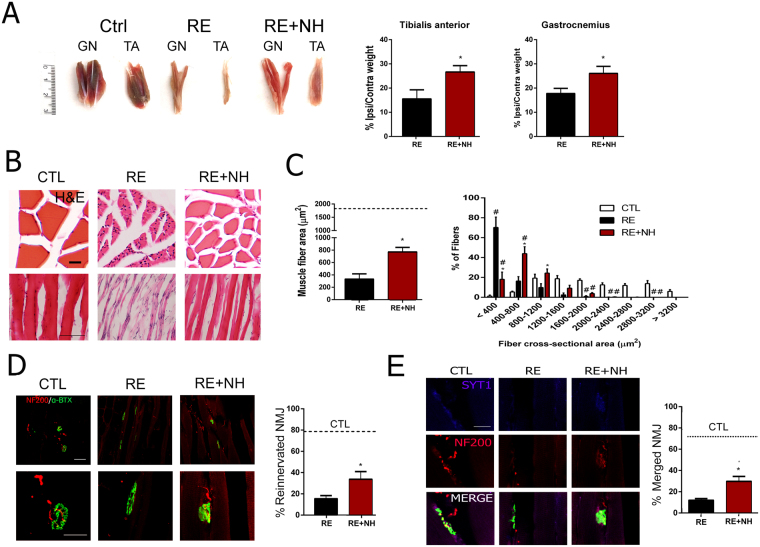
Figure 6.
Muscle atrophy is reduced and numbers of functional endplates are increased by NH treatment. (A) Left, Representative photographs of GA and TA muscles from contralateral regions of RE rats (CTL) and ipsilateral from untreated (RE) and NH-treated (NH + RE) rats at 6 months post RE. Right, Histograms of weight ratio between ipsilateral and contralateral TA and GA muscles at 6 months post RE (n = 7–8; t-test, *p < 0.05 RE + NH vs. RE). (B) Representative microphotographs of cross (upper panel) and longitudinal (lower panel) TA and GA muscle sections with H&E staining from CTL, RE, and RE + NH groups at 6 months post RE. (C) Left, Means (±SEM) of the fiber cross-sectional areas (µm2) from GA muscles of indicated groups at 6 months post RE. Dotted line indicates the mean obtained from the CTL muscles (n = 4 per group; t-test, *p < 0.05 RE + NH vs. RE). Right, Histogram of the cross-sectional area distribution of fibers in GA. Each interval of the distribution contains ranges of 400 µm2 between the extremes (n = 4 per group), ANOVA, post hoc Bonferroni *p < 0.05 RE + NH vs. RE). (D) Left, Representative confocal images of GA transversal sections stained for NF200 (NF, red) and FITC-conjugated α-bungarotoxin (α-btx, green) from contralateral side of RE rats (CTL), ipsilateral side of RE rats, and NH-treated animals (RE + NH) at 6 months post RE. Right, Quantification of the percentage of reinnervated NMJs (red and green overlapping signal) analyzed with ImageJ software in RE and RE + NH groups compared to CTL (dotted line; n = 3–4; t-test, *p < 0.05 RE + NH vs. RE). (E) Representative microphotographs of SYT1 immunolabeling (magenta) and NF co-localization (red) in α-btx (green) neuromuscular junctions (NMJs). Scale bars = 20 µm in B (bottom panel) and E; 25 µm in D (bottom panel); 50 µm in D (upper panel); and 100 µm in B (upper panel).

