Figure 3.
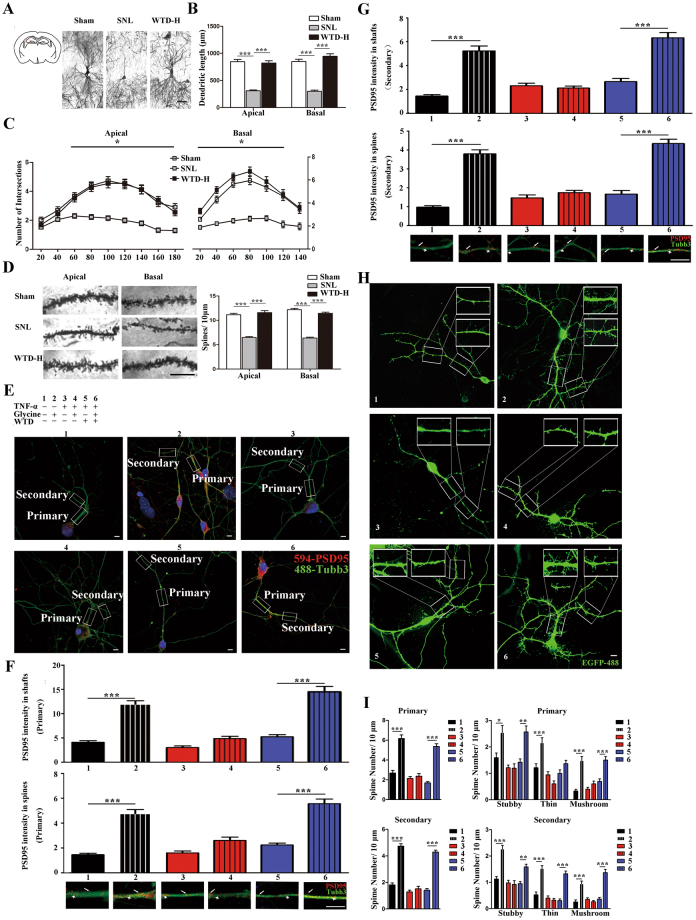
The SNL induced atrophy and WTD mediated rescue of hippocampal CA3 pyramidal neurons on D21. (A) – (D) presented the atrophy and rescue of CA3 pyramidal neurons on the right side (n = 4 mice per group). (A) Shows the location and the imaging of the entire pyramidal neurons, scale bar 100 μm. The atrophy is evaluated from dendritic length (B), dendritic intersections (C), and spine density (D) (enlarged pictures show the spine density, scale bar 10 μm) (*P < 0.05, ***P < 0.001) (Mean ± S.E.M, at least 38 neurons pictured from 3 mice were analyzed in each group). (E–I) presented the TNF-α mediated inhibition and WTD mediated rescue of primary hippocampal neurons undergo the activation by glycine. (E) Indicates the grouping conditions and the Z-projection confocal images of the TUBB3 labelled neurons with primary and secondary dendrites, in which the red dots indicates the positive dyeing of PSD95, scale bar 10 μm). The magnification of the primary (F) and secondary (G) dendrites, in which the arrowheads indicate the expression of PSD95 in the shafts and the arrows indicate the expression of PSD95 in the spines. Quantification data is shown in bar figures (***P < 0.001, Mean ± S.E.M, at least 30 neurons pictured from 3 cultures are analyzed in each group). (H) Z-projection confocal images of the GFP labelled neurons with the enlarged photos showing the stubby, thin and mushroom spines in both the primary and secondary dendrites, scale bar 10 μm. (I) quantification data is shown in bar figures (**P < 0.01, ***P < 0.001, Mean ± S.E.M, at least 30 neurons pictured from 3 cultures are analyzed in each group).

