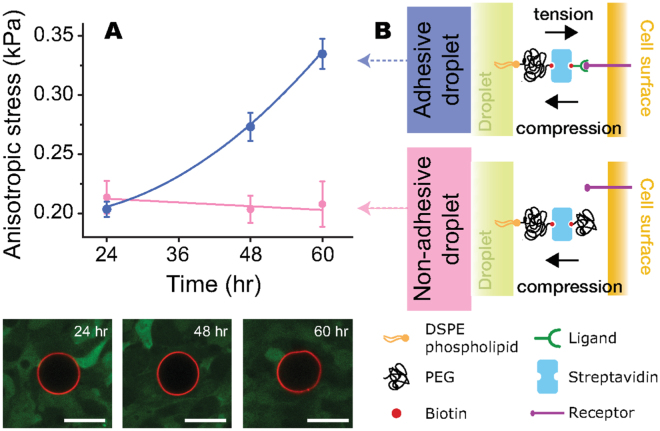
Figure 5.
Temporal evolution of average cell-generated compressive and tensile stresses within growing 3D aggregates of tooth mesenchymal cells. (A) Average cellular anisotropic stresses for aggregates at 24, 48 and 60 hours (top), measured with droplets coated with RGD peptides (blue circles) or mPEG (orange squares) to quantify compressive and tensile stresses (see panel B). Confocal sections of RGD-coated droplets (red; surface label) embedded between cells (green) of the aggregate at different stages are shown; the increase in the magnitude of droplet deformations (i.e., stresses) over time is directly visible (bottom). Scale bars 20 μm. For 24, 48 and 60 hours, N = 30, 30, and 24, respectively, for droplets coated with RGD peptides, and N = 6, 5, and 5, respectively, for droplets coated with mPEG (N = number of aggregates). (B) Schematic representation of adhesive and non-adhesive droplets. Adhesive droplets, coated with ligands targeting cell adhesion receptors (RGD peptide in this case), enable the transmission of pulling cellular forces (tensile stresses), in addition to compressive stresses. Non-adhesive droplets are coated with PEG, preventing cell-droplet adhesion, and only allowing the measurement of (non-specific) compressive stresses.

