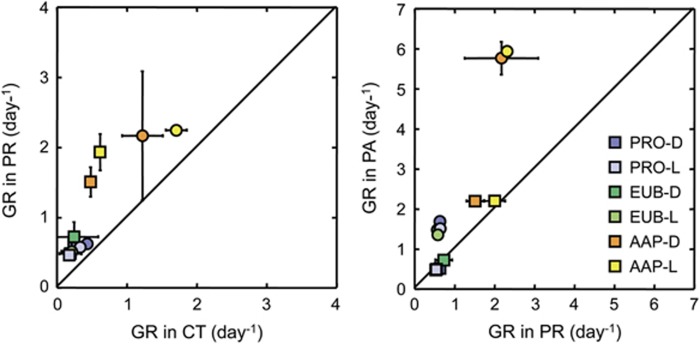
Figure 1.
Growth rates in the predator-reduced (PR) vs the control (CT) treatments (left panel) and in the phosphorus-amended (PA) vs the PR treatments (right panel). Circles correspond to Experiment 1 and squares to Experiment 2. Dots falling on the 1:1 line indicate that growth rates have the same value for both x-y treatments; if dots are above or below the line, growth rates from y treatments are higher or lower than in x treatments respectively. Error bars represent the standard deviations. AAP, aerobic anoxygenic phototrophic bacteria; D, Dark incubations; EUB, Eubacteria; L, Light-dark incubations; PRO, total prokaryotes.

