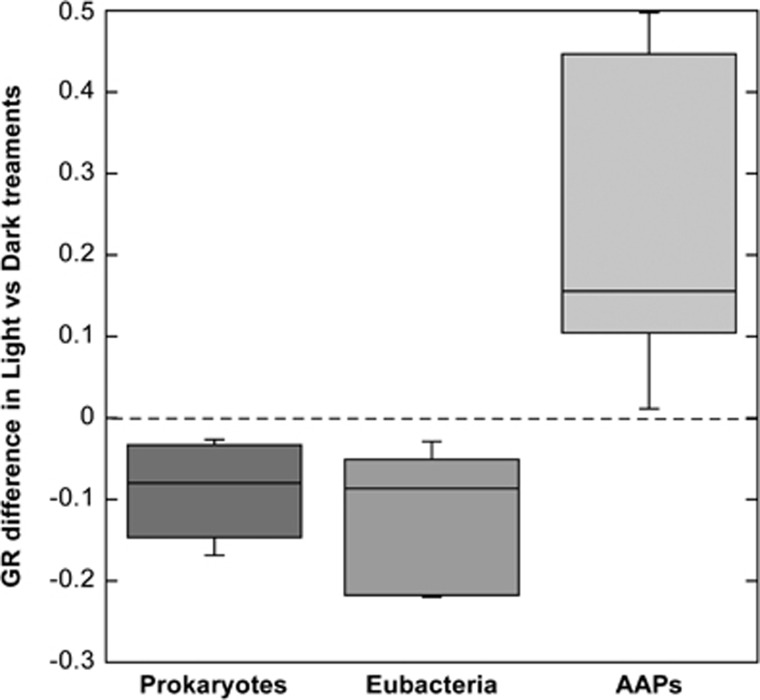
Figure 2.
Box plots showing the distribution of the difference between growth rates (GR) in the light and dark treatments (positive values indicate higher growth rates in the light and vice versa) for the microbial groups studied. Values from all treatments and experiments are pooled. From top to bottom, the horizontal lines of the box represent the upper-quartile, median and lower-quartile. Whiskers extending from top and bottom of the box represent maximum and minimum values. AAP, aerobic anoxygenic phototrophic bacteria; EUB, Eubacteria; PRO, total prokaryotes.

