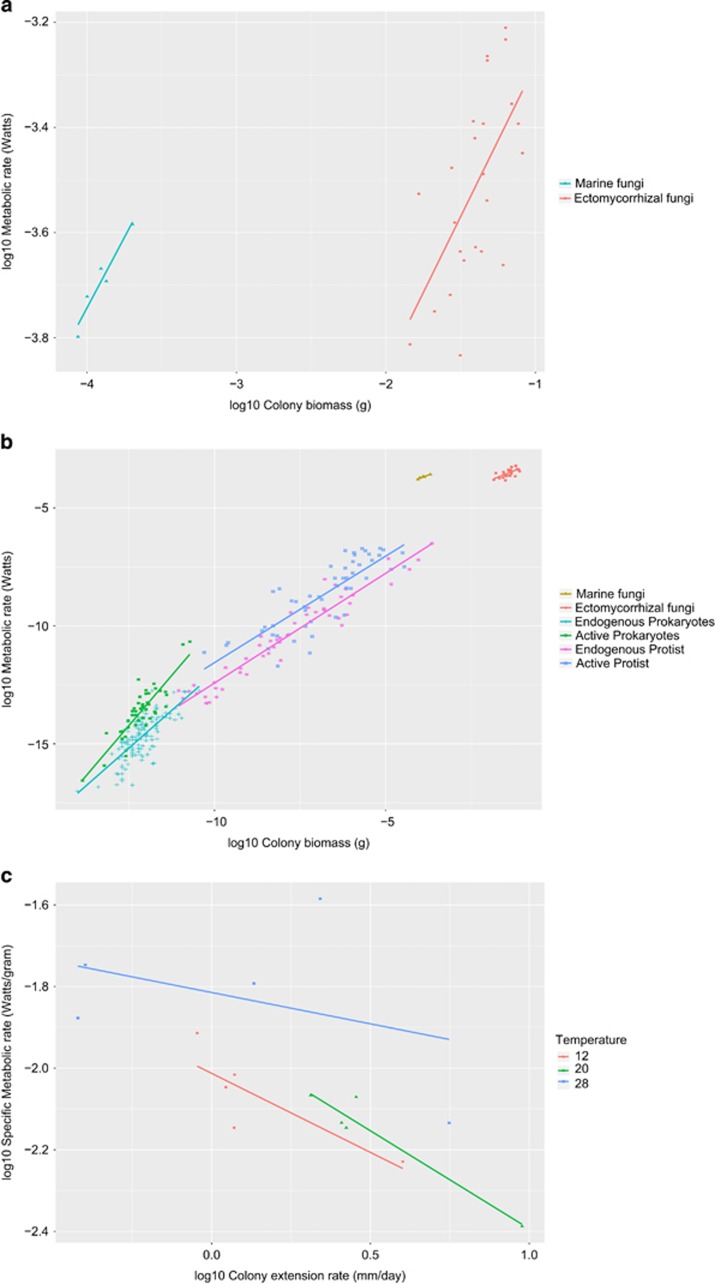
Figure 1.
Metabolic scaling to body size (biomass) of different groups of organisms. Scaling parameters for the regression lines are presented in Table 1. (a) Metabolic scaling to colony biomass for five species of marine fungi and 11 strains of ectomycorrhizal fungi; (b) comparison of the fungal metabolic scaling with the ones of bacteria and protists at two metabolic states; (c) scaling of specific metabolic rate to colony extension rate for a set of five species of saprotrophic fungi. Different colors and symbols represent different groups and metabolic states. Regression lines were fitted using ordinary least squares method.

