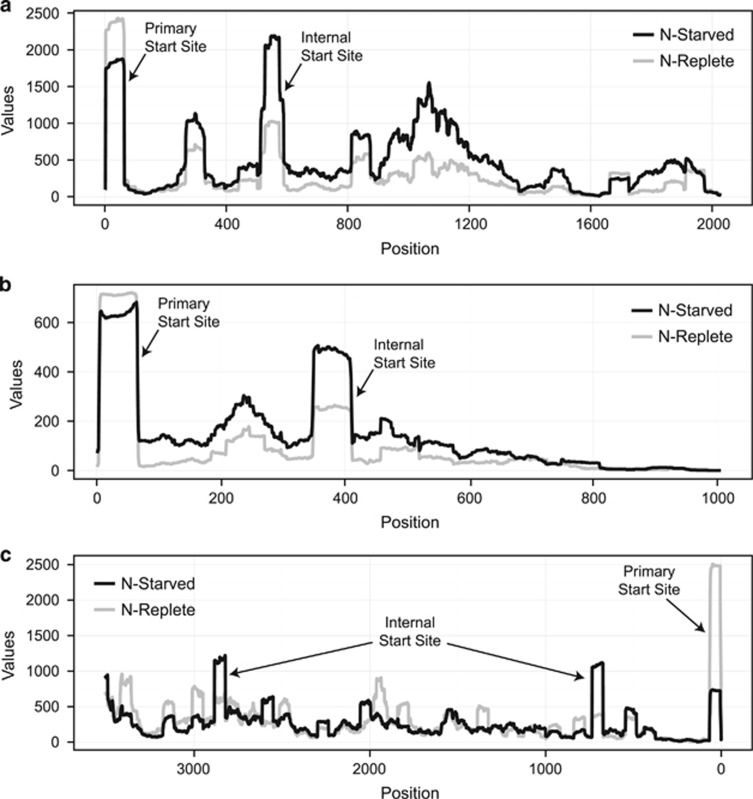
Figure 2.
Primary transcriptome mapping to three genes during N deprivation. Values indicate the number of primary reads mapping to the (a). PMM0149 (ndhF), (b). PMM0058 (conserved hypothetical protein) and (c). PMM1485 (rpoB) genes. Experimental (black) and control reads (grey) were compared at 12 h post N deprivation. The primary and internal TSSs are marked with arrows in each panel. Each panel represents the full length of the gene, with the x-axis representing the distance from the primary start site.

