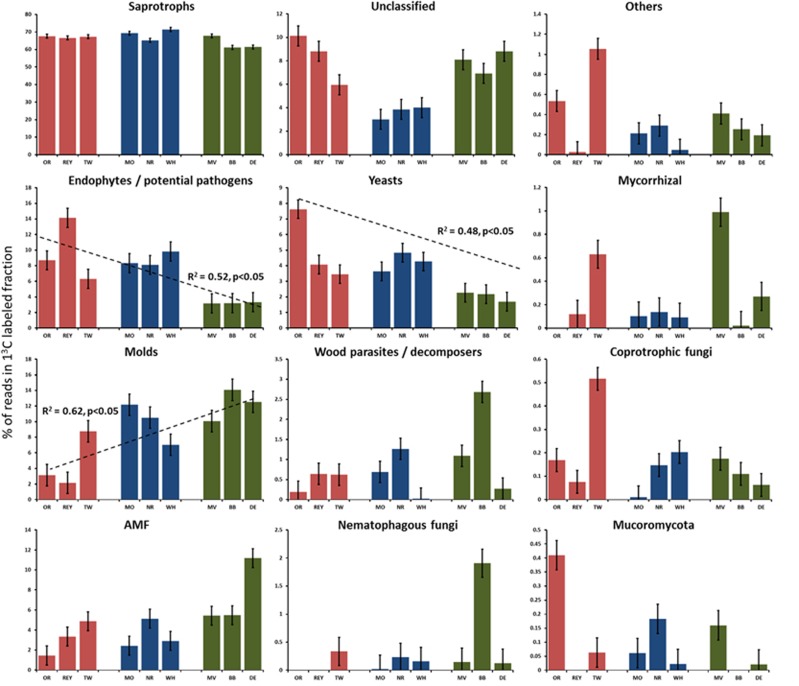
Figure 3.
Fungal functional groups using recently photosynthesized carbon from plants affected by the time since agricultural abandonment. The recently abandoned fields are represented by red bars, mid-term abandoned fields by blue and long-term abandoned fields by green. The bars represent averages and error bars represent s.e. The significant trends in time are shown in the figure; for significance between treatments, see text. The groups are ordered based on their abundances in samples starting from the most abundant group. The full colour version of this figure is available at ISME Journal online.

