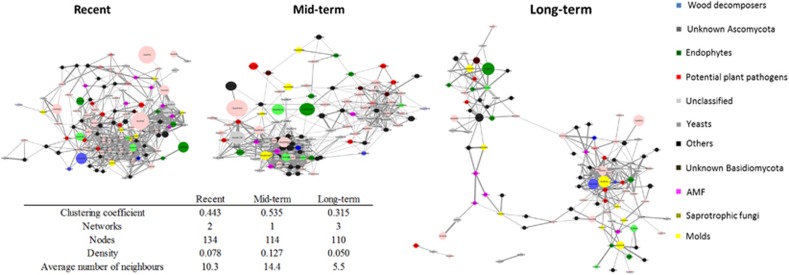
Figure 5.
Development of network topology abandonment time. Only significant (P<0.05) positive correlations are visualized. The node size is proportional to the percentage of abundance of the organism and edge darkness is scaled to the strength of the correlation (Pearson’s rho). OTUs presented in the figure are grouped to functional groups (see text) and colored based on function. Network parameters such as clustering coefficient, number of nodes, density and number of neighbors are presented in the figure. The full colour version of this figure is available at ISME Journal online.

