FIG 2.
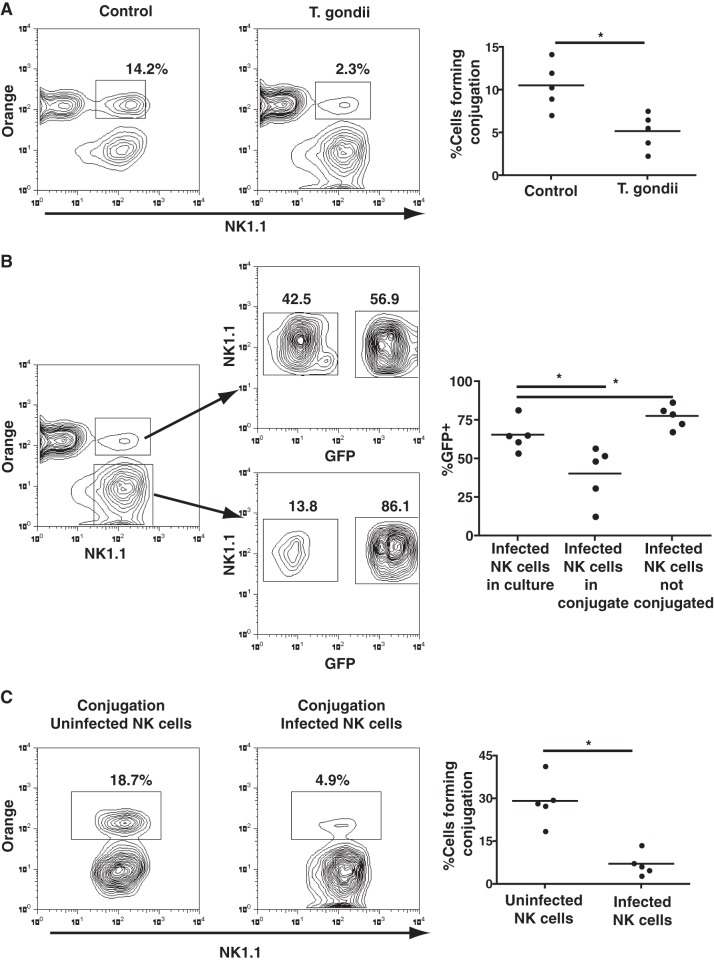
Impaired conjugate formation of T. gondii-infected NK cells with YAC1 cells. (A) (Left and middle) NK cell conjugate formation to YAC1 cells comparing control NK cells (left) with NK cells exposed to T. gondii (middle); (right) the graph compares the percentage of NK cells forming conjugates from both cultures. *, P < 0.05, Mann-Whitney test (n = 5 separate experiments). (B) (Left) Percentage of infected (GFP+) NK cells and uninfected (GFP−) NK cells found conjugated to YAC1 cells and percentage of infected (GFP+) NK cells and uninfected (GFP−) NK cells that did not form conjugates; (right) the graph represents the percentage of GFP+ NK cells that were conjugated and unconjugated relative to the percentage of infected NK cells added to the culture. *, P < 0.05, ANOVA (n = 5 separate experiments). (C) (Left and middle) Examination of the percentage of GFP− NK cells and GFP+ NK cells forming conjugates from the middle panel of panel A; among the 2.3% of cells forming conjugates, the majority were uninfected NK cells; (right) the graph compares the percentages of uninfected and infected cells conjugated to YAC1 cells from all experiments. *, P < 0.05, paired t test (n = 5 separate experiments).

