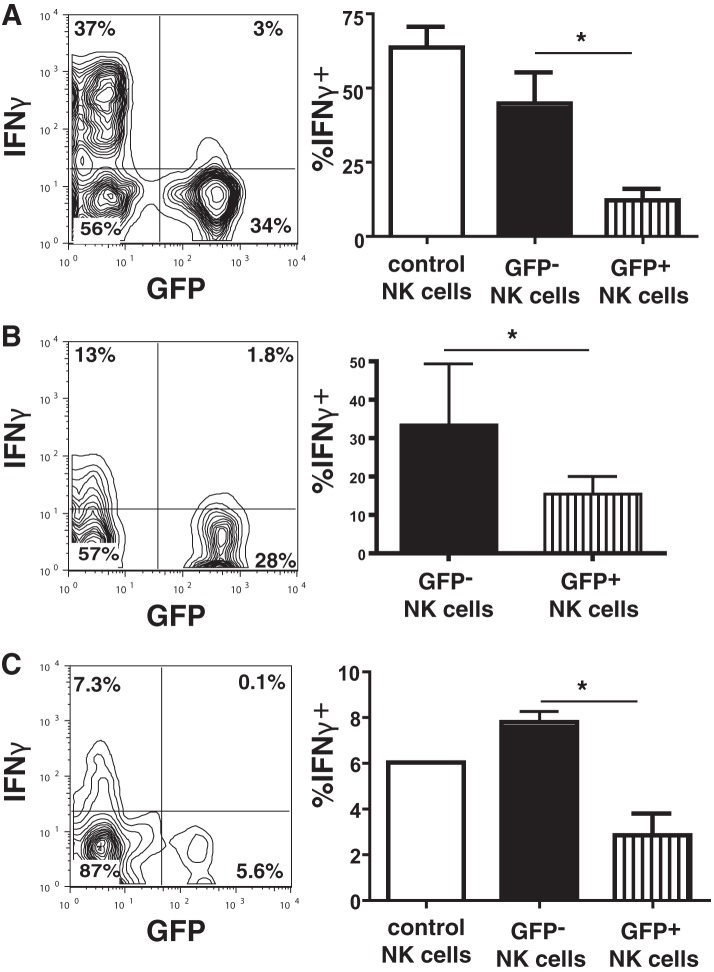
FIG 3.
T. gondii infection of NK cells inhibits IFN-γ production. (A) IFN-γ production by NK cells upon IL-12 and IL-18 stimulation following infection with the type I RH-LDM strain. (Left) Results of one representative experiment with infected (GFP+) or uninfected (GFP−) NK cells; (right) bar graph representing the percentage of IFN-γ+ cells gated on infected (GFP+) or uninfected (GFP−) NK cells separately from all experiments. *, P < 0.01, ANOVA with the Bonferroni correction (n = 7 separate experiments). Control NK cells represent NK cells not exposed to T. gondii in culture. (B) IFN-γ production by NK cells upon IL-12 and IL-18 stimulation following infection with the type II PTG-GFPS65T strain. (Left) Results of one representative experiment with infected (GFP+) or uninfected (GFP−) NK cells; (right) bar graph showing the percentage of IFN-γ+ cells gated on the infected (GFP+) or uninfected (GFP−) NK cells separately from all experiments. *, P < 0.05, paired t test (n = 3 separate experiments). (C) IFN-γ production by NK cells following NK1.1 cross-linking. (Left) Results of one representative experiment with infected (GFP+) or uninfected (GFP−) NK cells; (right) bar graph representing the percentage of IFN-γ+ cells gating on infected (GFP+) or uninfected (GFP−) NK cells separately from all experiments. *, P < 0.01, Mann-Whitney test (n = 4 separate experiments).

