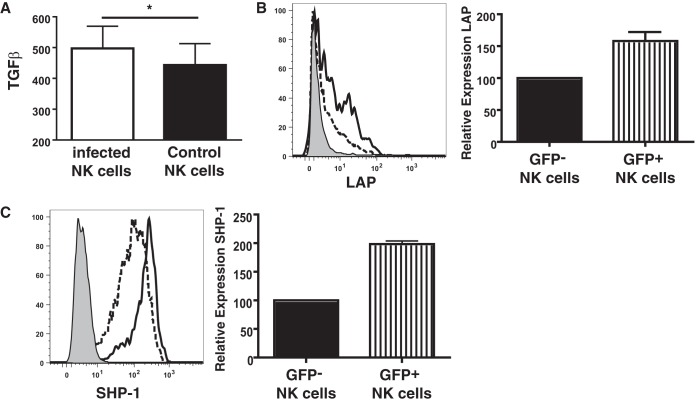
FIG 5.
Expression of TGF-β and SHP-1 by infected NK cells. (A) Levels of TGF-β from cultures of freshly isolated NK cells from B6.RAG1−/− mice exposed to or not exposed to T. gondii measured by ELISA following overnight culture. *, P < 0.05, paired t test (n = 6). (B) (Left) Percent surface expression of LAP on freshly isolated NK cells following 2 h of infection with T. gondii and 4 h of culture in vitro (dashed line, uninfected cells; solid line, infected cells; shaded area, isotype control); (right) bar graph representing the increase in the level of LAP on infected (GFP+) NK cells relative to that on uninfected (GFP−) NK cells from three separate experiments. (C) (Left) Percent intracellular expression of SHP-1 on freshly isolated NK cells following 2 h of infection with T. gondii and 4 h of culture in vitro (dashed line, uninfected cells; solid line, infected cells; shaded area, isotype control); (right) bar graph representing the increase in the level of SHP-1 in infected (GFP+) NK cells relative to that in uninfected (GFP−) NK cells from six separate experiments.

