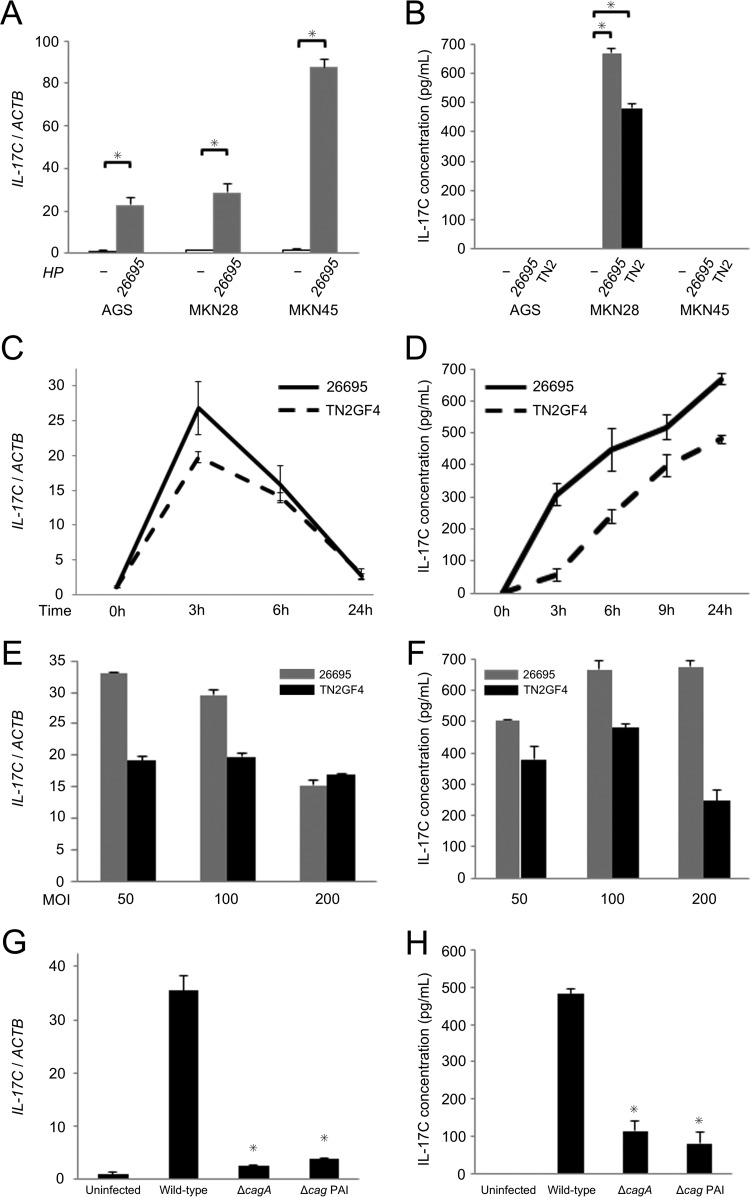
FIG 7.
IL-17C mRNA and protein levels in gastric epithelial cell lines in response to H. pylori infection. (A) IL-17C mRNA levels in AGS, MKN28, and MKN45 cells. Cells were infected with H. pylori strain 26695 for 3 h at an MOI of 100. (B) IL-17C protein levels in AGS, MKN28, and MKN45 cells determined by ELISA. Cells were infected with H. pylori strain 26695 and TN2GF4 for 24 h at an MOI of 100. (C) IL-17C mRNA levels in MKN28 cells. Cells were infected with H. pylori strain 26695 and TN2GF4 for different time periods (0, 3, 6, and 24 h) at an MOI of 100. (D) IL-17C protein levels in MKN28 cells. Cells were infected with H. pylori strain 26695 and TN2GF4 for different time periods (0, 3, 6, and 24 h) at an MOI of 100. (E) IL-17C mRNA levels in MKN28 cells. Cells were infected with H. pylori strain 26695 and TN2GF4 for 3 h at different MOIs (50, 100, and 200). (F) IL-17C protein levels in MKN28 cells. Cells were infected with H. pylori strain 26695 and TN2GF4 for 24 h at different MOIs (50, 100, and 200). (G) IL-17C mRNA levels in MKN28 cells. Cells were infected with TN2GF4 wild type and cagA and cag PAI mutants for 3 h at an MOI of 100. (H) IL-17C protein levels in MKN28 cells. Cells were infected with TN2GF4 wild type and cagA and cag PAI mutants for 24 h at an MOI of 100. Error bars represent the standard deviations obtained from three experiments. Statistical differences between treated and control samples were analyzed using Student's t test. *, P < 0.05.

