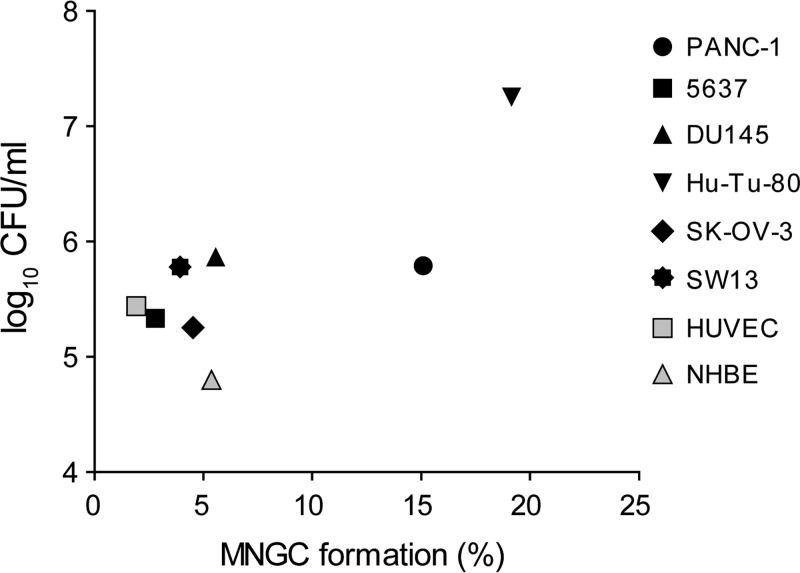
FIG 5.
Intracellular loads of wild-type B. thailandensis in relation to the extent of MNGC formation. The diagram shows average values of final intracellular CFU of wild-type B. thailandensis plotted against average values of MNGC formation (%) for each cell line (black symbols), primary endothelial cells (HUVEC), and epithelial cells (NHBE) (gray symbols).

