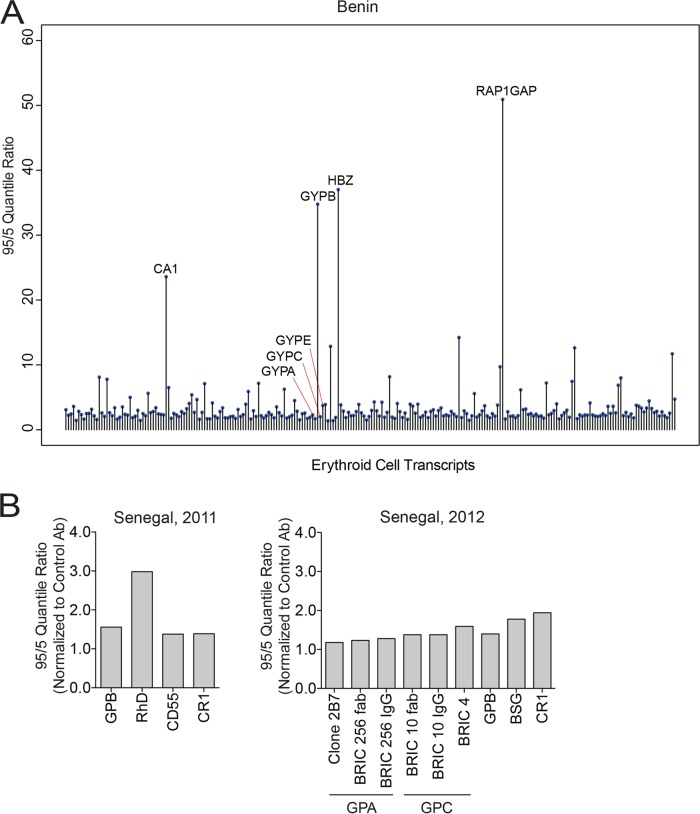
FIG 1.
Glycophorin B transcript level variation and erythrocyte receptor expression among individuals in regions where malaria is endemic. (A) Graph highlighting transcripts, including GYPB, whose abundance varied widely among erythroid cell-specific transcripts from 61 healthy individuals in Benin. Bioinformatic analysis was based on the whole blood transcriptomics study of malaria-infected and healthy children in Benin (36). (B) Expression of GPB and other erythrocyte receptors from blood of healthy Senegalese donors in 2011 (left graph) and 2012 (right graph). The graphs show the 95/5 quantile ratio normalized to the quantile ratio for a control secondary antibody (Ab). The quantile ratio was based on mean fluorescence intensity values determined by flow cytometry. In 2011, measurements were made on RBCs from 29 donors (GPB), 32 donors (CD55 and CR1), or 41 donors (RhD), and in 2012, they were made on RBCs from 11 donors (GPB) or 29 donors (all other receptors). In 2011, one GPB-null individual and three RhD-null individuals were observed but were excluded from measurement of the 95/5 quantile ratio. In 2012, three different probes were used to measure expression of GPA and GPC (see Materials and Methods).

