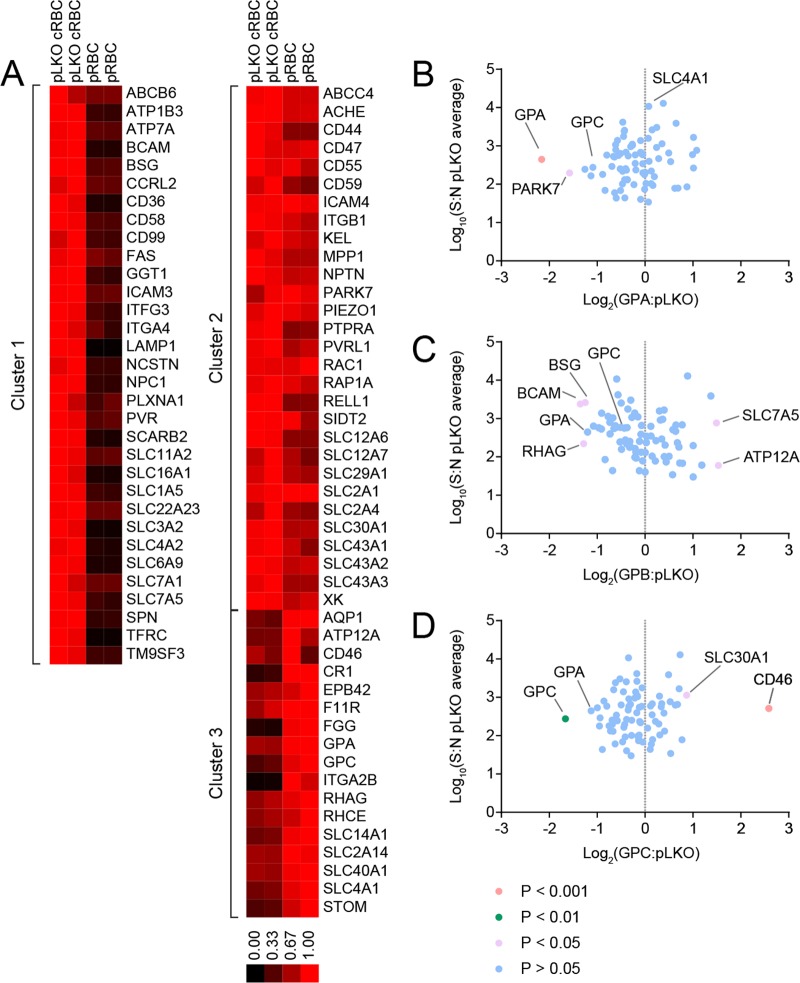
FIG 3.
Quantitative cell surface proteomics of peripheral erythrocytes and cultured erythrocytes. (A) Quantitative cell surface proteomic comparison between pLKO cRBCs and peripheral RBCs (pRBCs). k-means clustering analysis of the 78 surface membrane proteins identified three clusters: cluster 1, proteins that decrease between pLKO cRBCs and pRBCs; cluster 2, proteins that remain at the same level between pLKO cRBCs and pRBCs; and cluster 3, proteins that increase between pLKO cRBCs and pRBCs. The scale bar represents the normalized relative abundance of each protein. Note that the peptides detected by this technique did not allow a distinction to be made between GPA and GPB. (B to D) Comparison of the relative abundances of membrane proteins between the pLKO control cRBCs and either the GPA KD cRBCs (B), GPB KD cRBCs (C), or GPC KD cRBCs (D). Fold change was calculated as the ratio of the signal/noise ratio for GPA/B/C KD) to the average signal/noise for the pLKO control. y axes show the average signal/noise (S:N) ratio across all samples. P values were estimated using Benjamini-Hochberg-corrected significance A, calculated in Perseus v 1.5.1.6.

