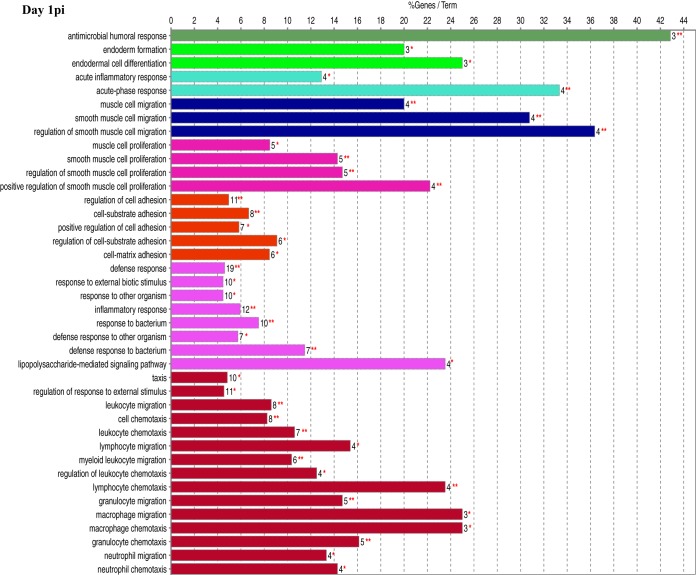
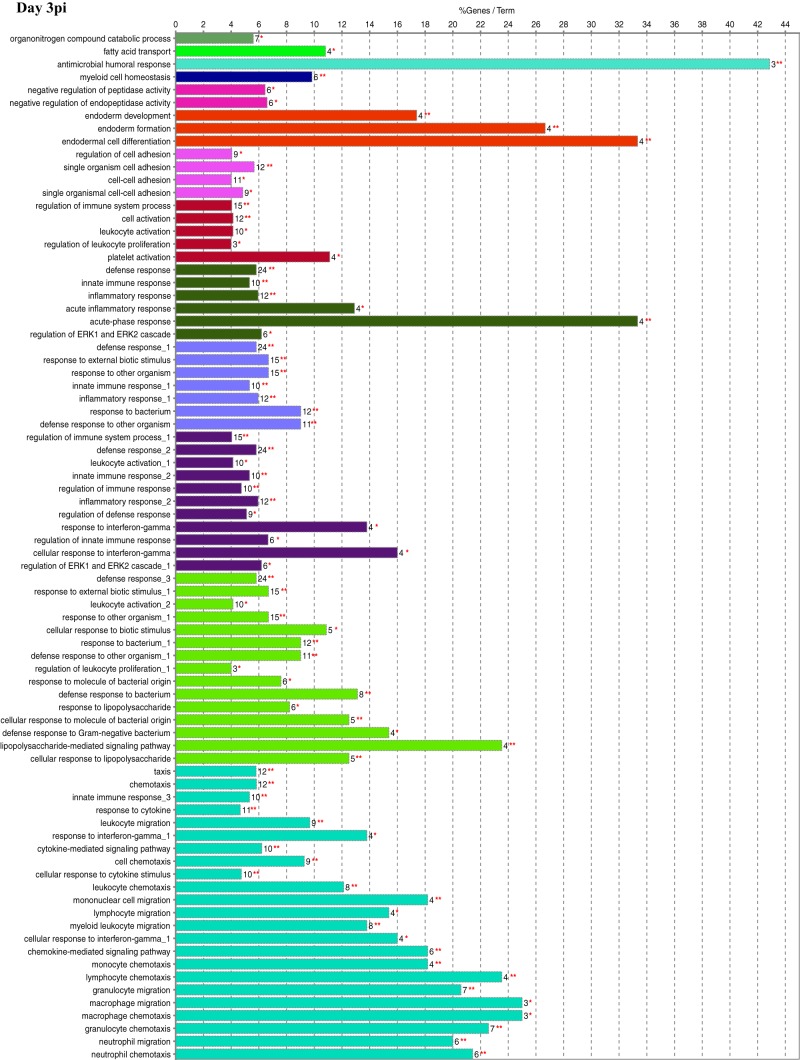
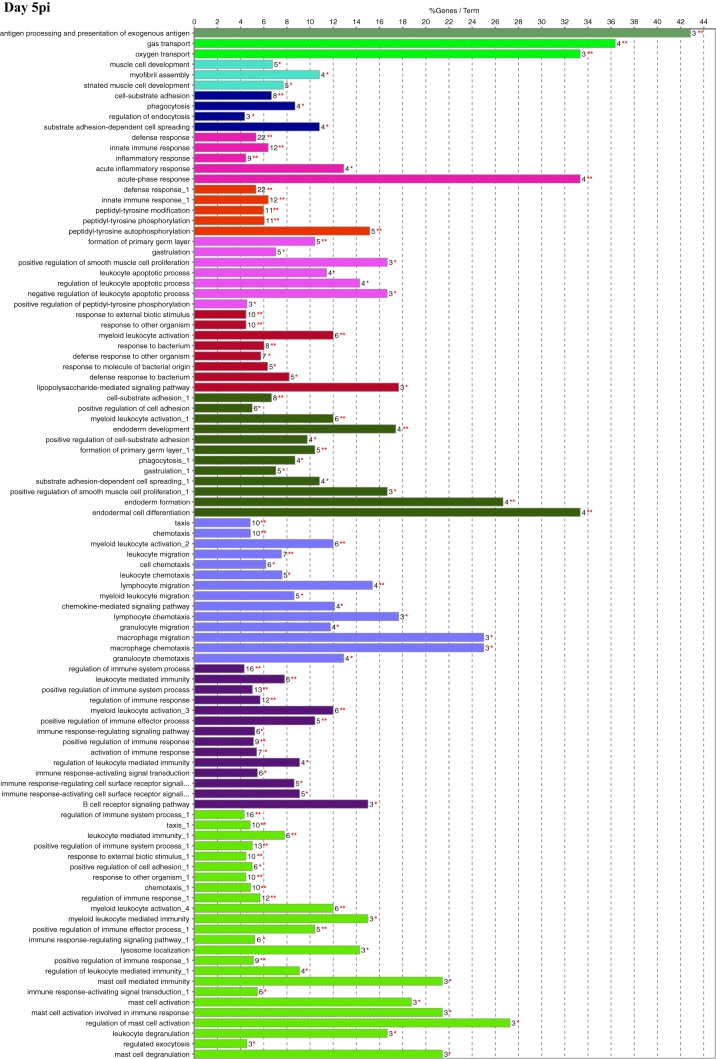
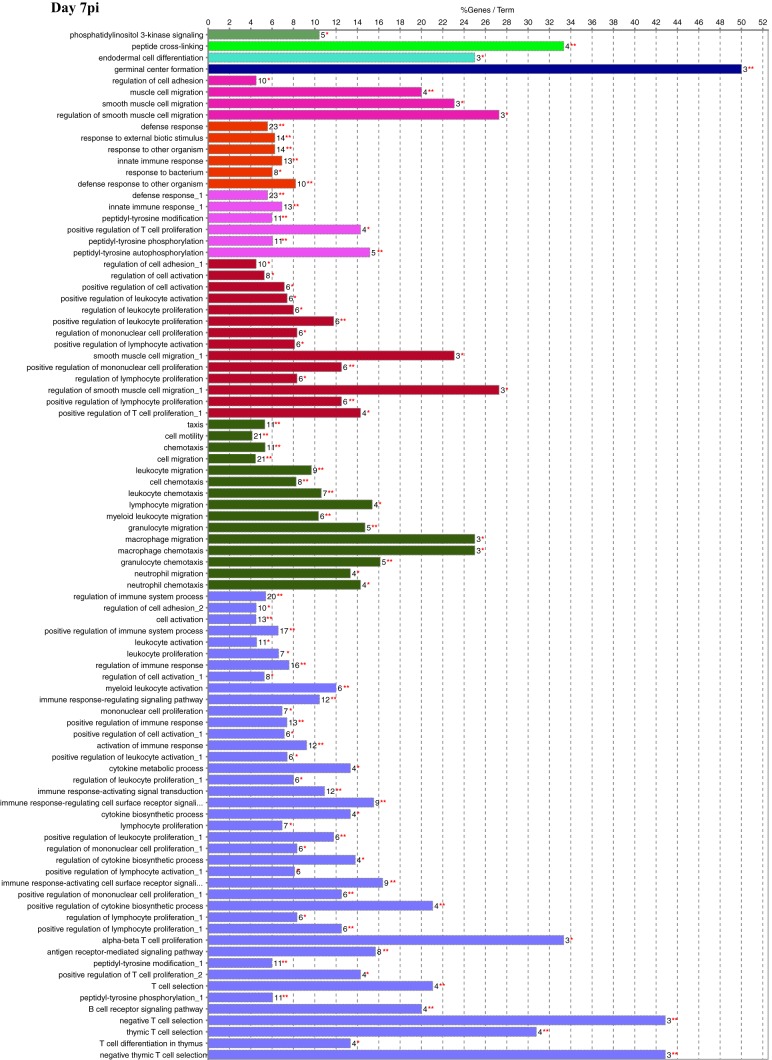
FIG 3.
Functional gene ontology. Significant DEGs with a log2 fold change of ≥2.00 were analyzed for enriched biological processes using the ClueGO application for Cytoscape. Bars represent the percentage of associated genes assigned to a unique GO term with the absolute number of associated genes located at the end of the bars. The color of the bars indicates functionally related groups based on the similarity of associated genes. The significance levels of enriched biological processes are indicated (*, P ≤ 0.05; **, P ≤ 0.001).


