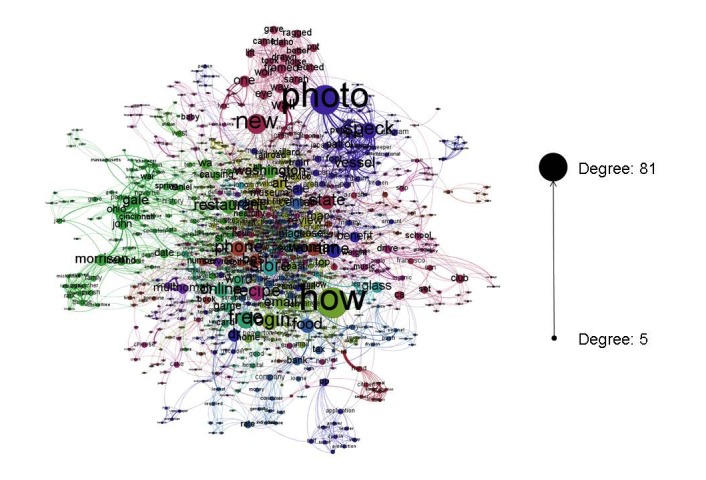
Figure 1.

A social network diagram of participant searches over the past year. Search terms are connected to each other if they appeared in the same search, and stronger connections indicate they appeared more frequently together. Each term is sized by the degree of the node, which represents the number of unique terms that are connected to that term. Terms are colored by community, where terms that are frequently searched for together are grouped into the same community.
