


Figure 2.
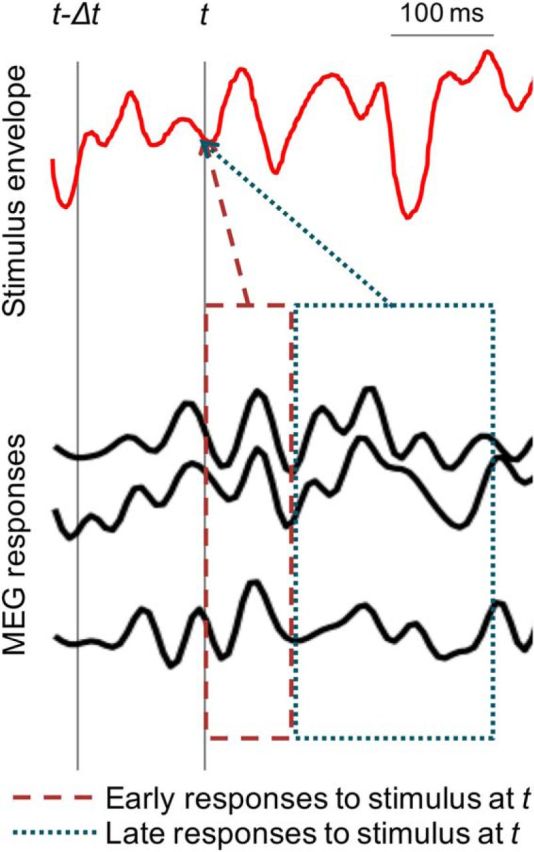
Early versus late MEG neural responses to a continuous speech stimulus. A sample stimulus envelope and time-locked multichannel MEG recordings are shown in red and black respectively. The two gray vertical lines indicate two arbitrary time points at t − Δt and t. The dashed and dotted boxes represent the early and late MEG neural responses to stimulus at time point t respectively. The reconstruction of the stimulus envelope at time t can be based on either early or late neural responses, and the separate reconstructions can be compared against each other.