Figure 5.

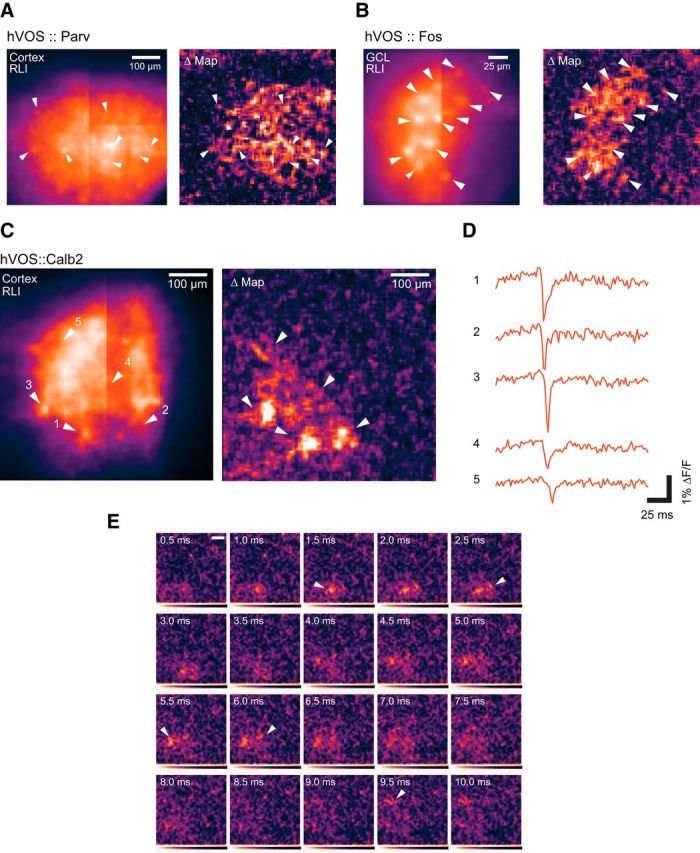
Network response to extracellular stimulation illustrated with spatial maps of peak response. A, A cortical slice from an hVOS::Parv mouse with RLI (left) illustrating probe fluorescence. The difference map of responses (Δ, right), with fluorescence inverted to render responses as brightness increases, was prepared as described in Data processing and analysis. Seven labeled cells where response peaks were evident are highlighted with arrowheads in the two maps. Stimulus was applied to layer 2/3 above the field of view. B, The DG slice from the hVOS::Fos experiment of Figure 4G was used to prepare a maximal response map with the same procedure used to prepare the map in A for the hVOS::Parv slice. The 12 responsive cells highlighted in Figure 4G produced foci in the maximal response map and are highlighted with arrowheads. C, In a slice of medial entorhinal cortex from an hVOS::Calb2 mouse, a stimulus was applied in layer 2/3 outside the field of view below and to the left. An RLI image (left) in layer 2/3 illustrates the distribution of hVOS probe. A difference map of the peak signal minus resting light (Δ, right) illustrates the spatial distribution of responses. Arrowheads indicate 5 responsive cells. D, Fluorescence versus time from ROIs containing the five neurons indicated in A show differences in response latency. E, Intensity maps at 500 μs intervals reveal the sequence of activation of neurons following stimulation. Arrowheads indicate the peak response of each cell in the frame where the peak occurs. The neurons are activated in the sequence of their labels. Displayed data were from five trial averages. The stimulus was 200 μA, 180 μs in all experiments.
