Figure 6.

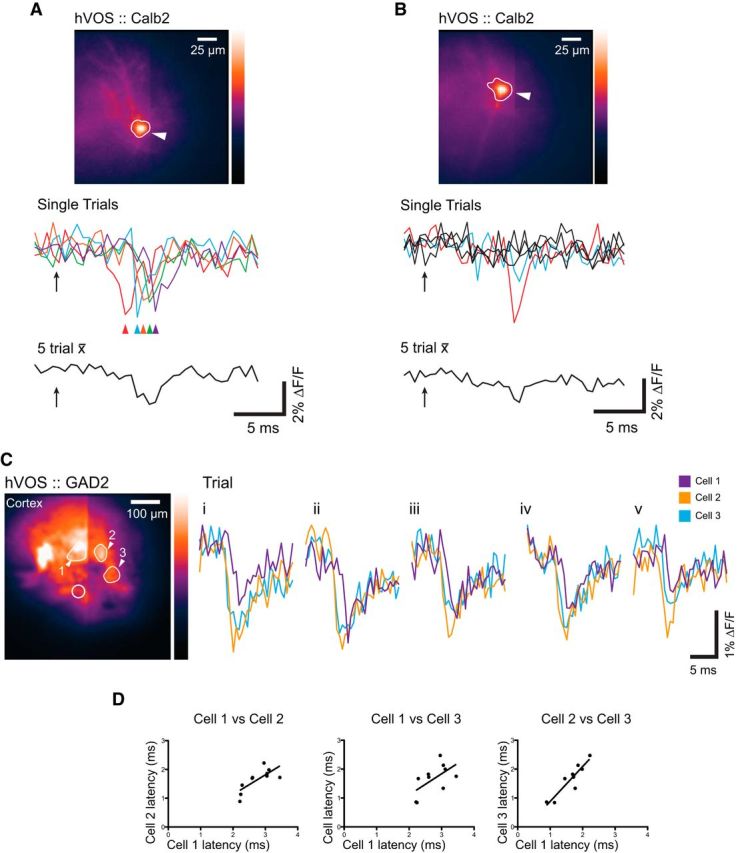
Single-trial recordings reveal trial-to-trial variations. A, Responses of a Calb2 cell in layer 2/3 of the somatosensory cortex. Five separate trials (multiple-colored traces) were taken at 10 s intervals. Colored arrows indicate the time of the observed spike peak in each trial. The 5 trial average is shown below. Arrow indicates stimulus time. The stimulus electrode was positioned above and left, just outside the field of view in layer 2/3. B, Another Calb2 cell in layer 2/3 of the somatosensory cortex clearly spiked in only 1 of 5 trials (red, blue, and black traces). The 5 trial average is shown below. A stimulus of 200 μA, 180 μs (at the arrow) was applied in layer 2/3, above and outside the field of view. C, Single-trial responses of 3 GAD neurons (indicated in the image by arrowheads and numbers) in the somatosensory cortex show variations in response latency. Colored traces represent five single-trial spikes from cells 1–3. Open circle represents site of stimulation. D, Response latencies (times from stimulus to half-peak amplitude) in 10 successive single-trial recordings from the three neurons in C, plotted against each other to evaluate correlations. Solid lines indicate the linear regression fits to the data.
