Figure 9.

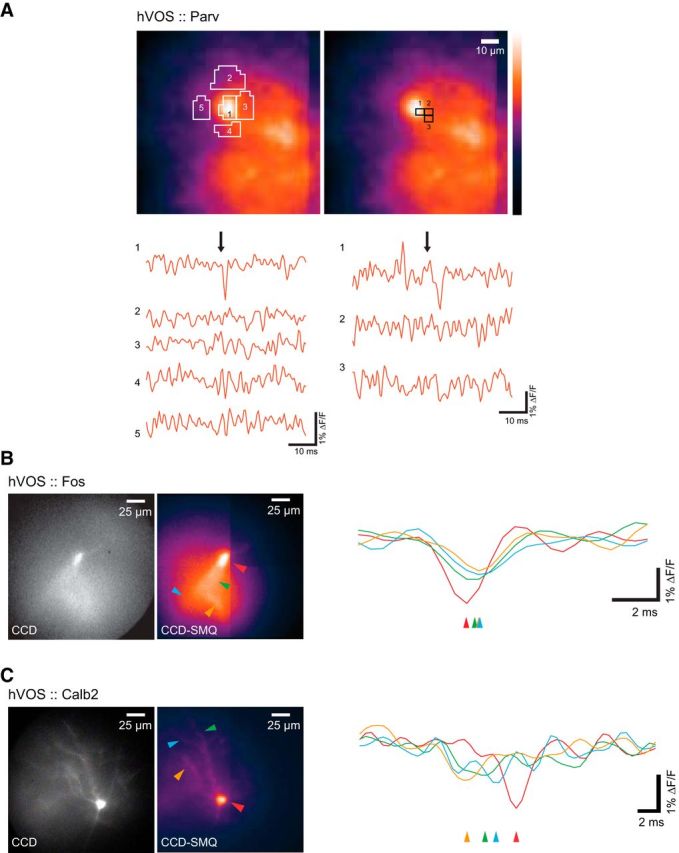
Voltage changes in different cellular compartments. A, Spatial resolution of hVOS responses in a somatosensory cortical slice from an hVOS::Parv mouse. Fluorescence traces from large ROIs (left) outlined, and small 2 × 2 pixel ROIs (right) boxed. B, A neuron in the granule cell layer of the DG from an hVOS::Fos mouse. A high-resolution CCD image (left) and CCD-SMQ image (middle) show a labeled neuron with a dendritic arbor. ROIs, including the cell soma (red) and proximal dendrites (green, orange, blue), are indicated with colors corresponding to the traces on the right. Arrowheads below the traces indicate the sequence of activation by outer molecular layer stimulation, demonstrating back-propagation from the soma to the dendrites. C, A cortical interneuron in layer 2/3 of the somatosensory cortex of an hVOS::Calb2 mouse. A high-resolution CCD image (left) and the CCD-SMQ image (middle) show a labeled cell with ROIs indicated. Stimulation (200 μA, 180 μs) generated hVOS responses in three dorsal dendrites (orange, green, and blue), which propagated to the soma (red). Arrowheads below traces indicate sequence of activation. Stimulus is in the layer 1/2 border, dorsal to the field of view. All traces are averages of five trials.
