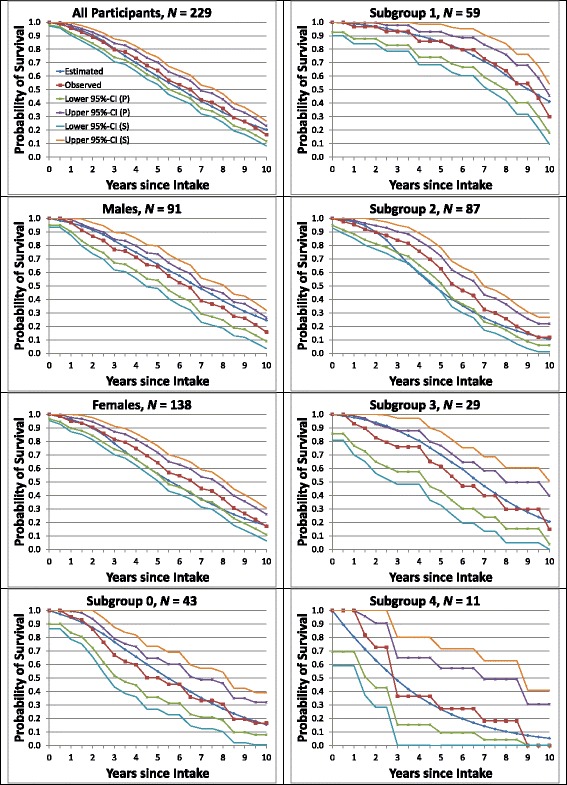
Fig. 2.

Observed vs. estimated average survival. Curves for average survival are shown separately for all participants and for males, females, and subgroups 0–4, with pointwise (P) and simultaneous (S) 95% confidence bands. Section 1.9 of Additional file 1: Appendix describes the calculations of the plotted values and their confidence bands
