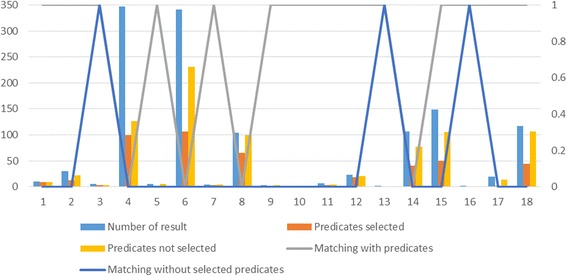
Fig. 13.

Matching results using methods Predicates selected and Predicates not selected. This figure shows a graphical representation of data from Table 6. The graphic contains the number of similar data items obtained using two approaches, Predicates selected and Predicates not selected, and similarity matching result based on human judgment (0 means that no matching exists, 1 means that a matching exists)
