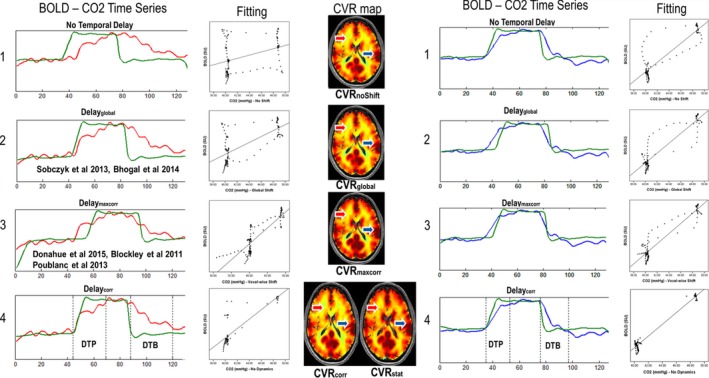
Figure 2.

CO 2 time evolution vs. BOLD signal in two illustrative voxels. For each processing method, the shifted CO 2 timeline (green) is plotted against the BOLD signal time series of two random voxels (one in the white matter: red, and one in the gray matter: blue) together with the linear fitting of the BOLD vs. CO2 scatter plot and the respective CVR map. In figure 2.1, the CO 2 time series correspond to CO 2 time course without time shift. figure 2.2 shows a single global CO 2 time shift for the whole‐brain (Delayglobal) and figure 2.3 correlation CO 2 time shift (CO 2‐BOLD) on a voxel‐wise basis after maximum correlation (Delaymaxcorr); figure 2.4 shows the respective duration of the DTP and the DTB for both voxels with the dynamic (CVR corr) and static (CVR stat) CVR maps. The fitting of figure 2.4 is based on CVR stat, scatter plot which shows clearly removal of the transition phases between the two static states. The shifts of the CO 2 timeline are: Delayglobal: red: 7 TRs, blue: 7 TRs; Delaymaxcorr: red: 20 TRs, blue: 5 TR; Delaycorr: red 9 TR, blue: 1 TR. CO 2, Carbon dioxide; BOLD, Blood‐oxygen‐level‐dependent; CVR, cerebrovascular reactivity; DTP, Delay to Plateau; DTB, Delay to Baseline
