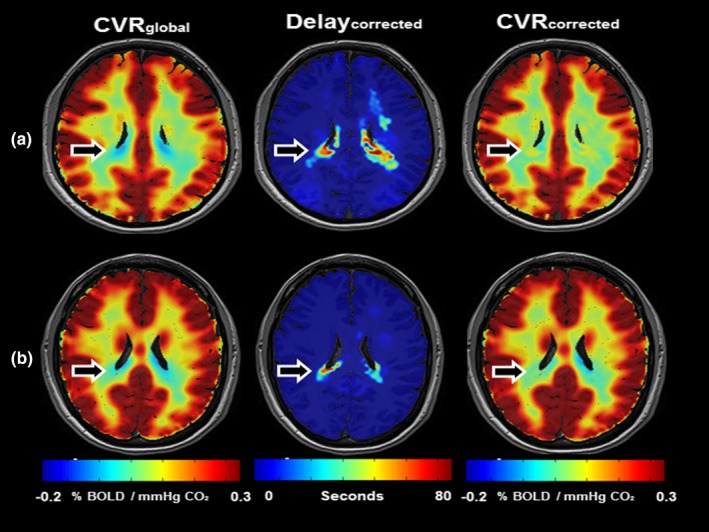
Figure 3.

Effect of arterial arrival time on CVR calculations. (a–b) shows a single axial slice of 2 CVR maps (CVR global and CVR corr) and a Delaycorr map of two representative subjects (age 24 and 26 respectively). CVR is color‐coded between −0.2% and 0.3% to increase CVR contrast and highlight changes. The Delaycorr is presented as an overlay on a T1‐weighted image and color‐coded between 0–80 s. Although subtle, it is obvious that in areas with prolonged Delaycorr negative CVR findings with CVR global are corrected after CVR corr calculation. Moreover, noticeable is that CVR contrast does not increase in all regions of the brain after Delaycorr implementation. In areas in the white matter without prolonged CO 2 arrival time, the Delayglobal presents a Delay value more closely matching the Delaymaxcorr then the Delaycorr. This results in an increased correlation between BOLD and CO 2 time series, enhancing CVR contrast. However, as is shown in Figure 2, this CO 2 arrival time also incorporates part of the dynamic response, which results in erroneous CVR calculations.
