Figure 4.

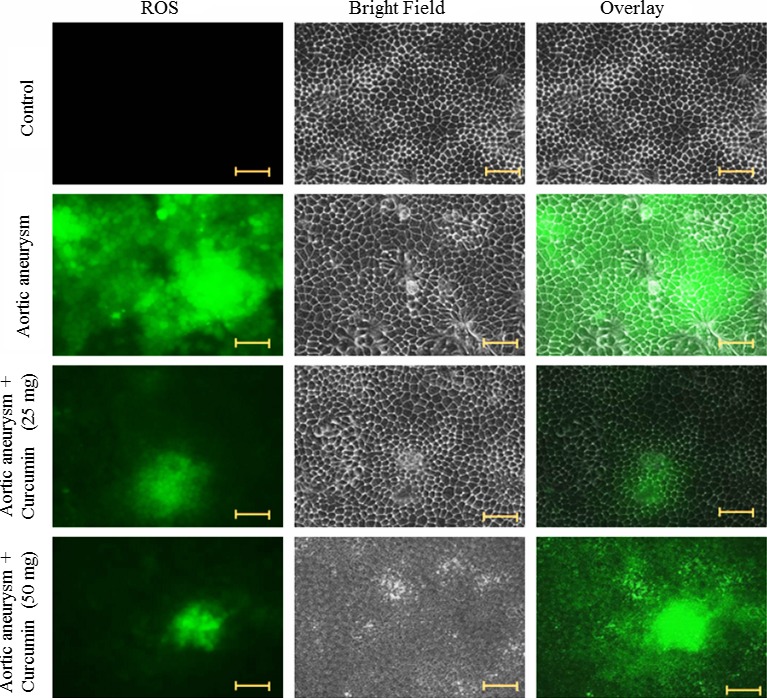
Effect of curcumin on ROS levels. Cells were exposed to the different concentration of curcumin and stained with DCF‐DA. Cells were viewed under a fluorescent microscope. Scale bar is 50 μm

Effect of curcumin on ROS levels. Cells were exposed to the different concentration of curcumin and stained with DCF‐DA. Cells were viewed under a fluorescent microscope. Scale bar is 50 μm