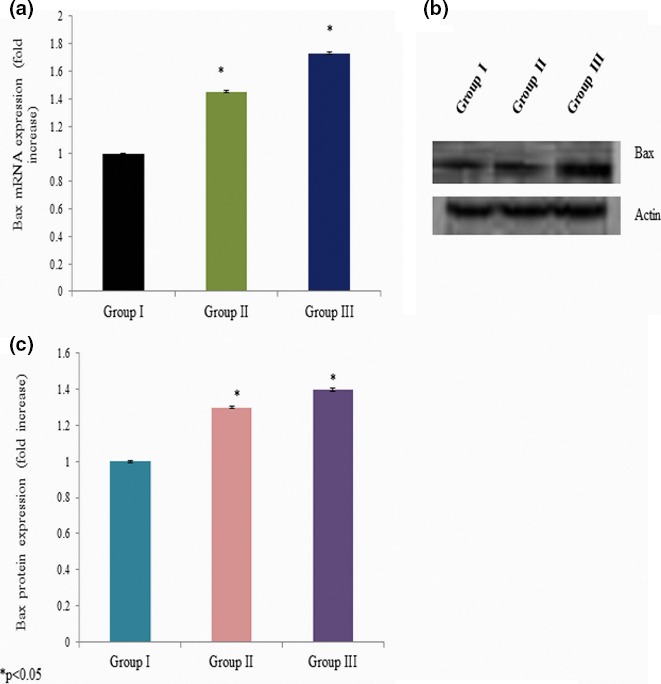
Figure 6.

Effect of curcumin on caspase‐3 mRNA and protein expression. Cells were exposed to the different concentration of curcumin and qPCR and Western blot analysis. The mRNA expression was expressed as fold change (a), protein expression was given as band (b), and “c” represents the densitometry values of “b”
