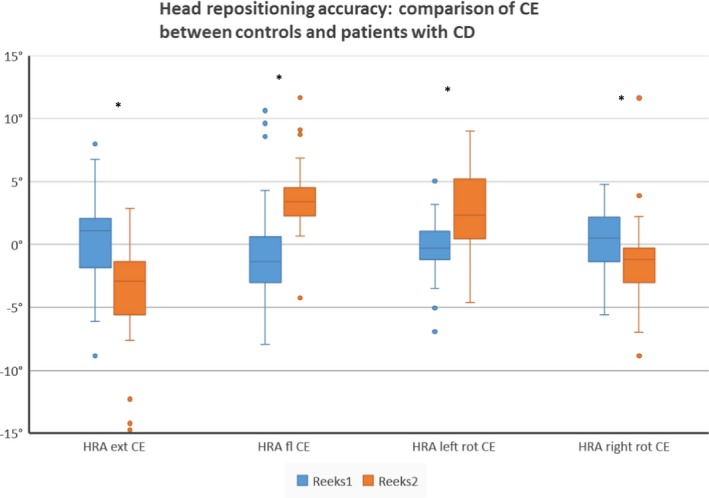
Figure 3.

Intergroup differences between controls and subject with CD for the constant error in the head repositioning accuracy test. Boxplots represent median and interquartile range of the constant error (CE) measured during the head repositioning accuracy test (HRA) after performing extension, flexion, left rotation, and right rotation (*significant at p < .05 level)
