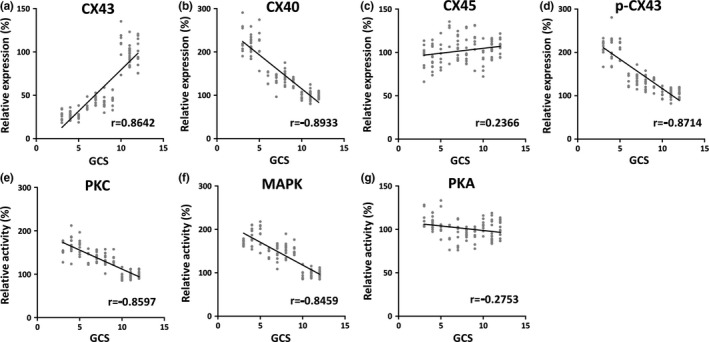
Figure 5.

Correlation studies between Glasgow Coma Scale (GCS) and CX43 protein level (a, r = .8642), CX40 protein level (b, r = −.8933), CX45 protein level (c, r = .2366), p‐CX43 protein level (d, r = −.8714), protein kinase C (PKC) activity (e, r = −.8597), mitogen‐activated protein kinas (MAPK) activity (f, r = −.8459), and protein kinase A (PKA) activity (g, r = −.2753) in all participants (n = 131)
