Fig. 1.

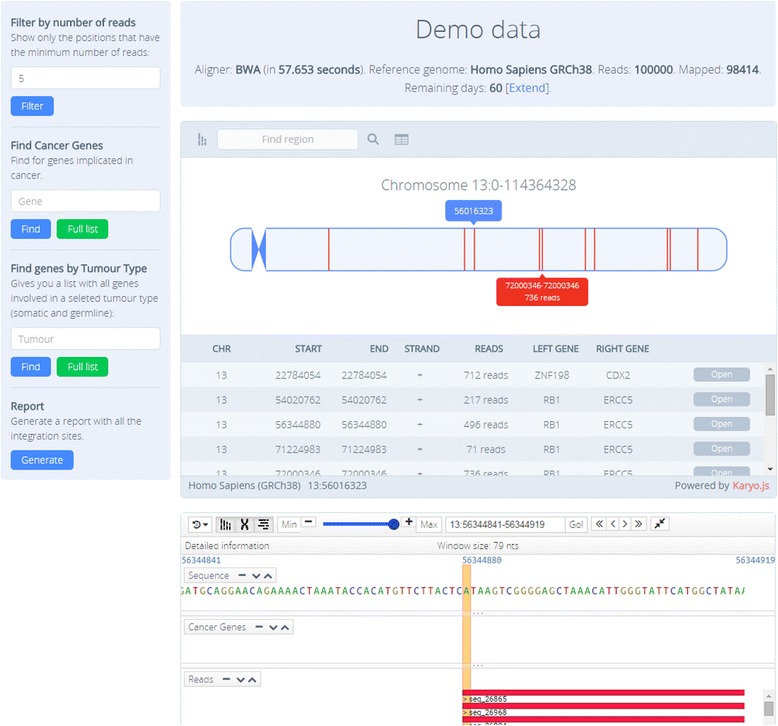
Screenshot showing the different graphical representations in the dashboard: the karyotype viewer and the genome viewer. Also, a table with the list of IS found is displayed

Screenshot showing the different graphical representations in the dashboard: the karyotype viewer and the genome viewer. Also, a table with the list of IS found is displayed