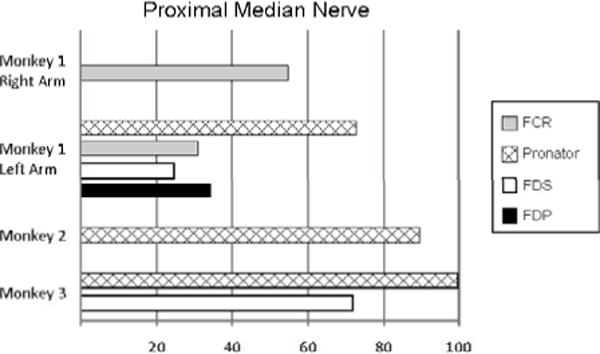
Figure 5.

The selectivity values displayed in the bar graph are the largest normalized recruitment values from a single contact. The selectivity values were the normalized values of muscle activation before 10% of another muscle was activated.

The selectivity values displayed in the bar graph are the largest normalized recruitment values from a single contact. The selectivity values were the normalized values of muscle activation before 10% of another muscle was activated.