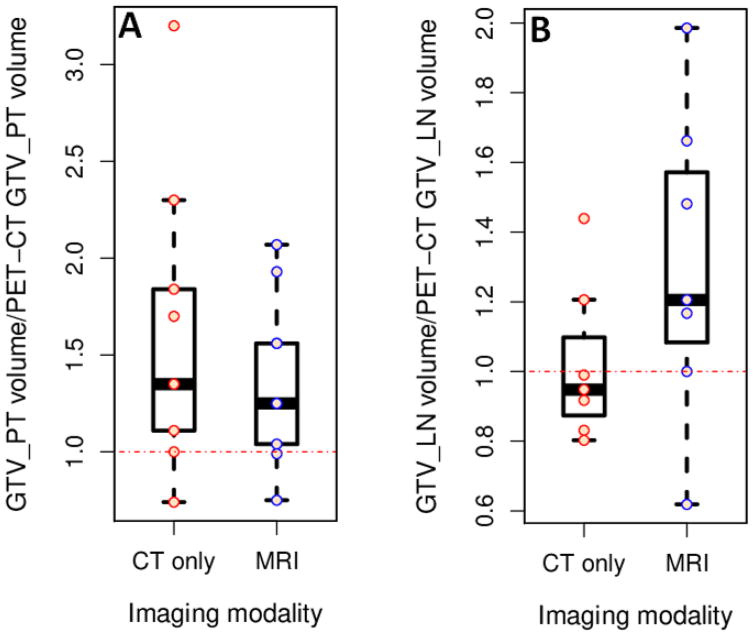
Figure 3.
CT and MRI based primary tumor (A) and lymph node (B) gross tumor volumes (GTVs) normalized by dividing average volume per patient by the corresponding PET-CT based volume. Boxes represent the inter-quartile range (IQR) extending from first quartile (Q1) to third quartile (Q3), respectively. Whiskers extend from Q1 and Q3 to end points that are typically defined as the most extreme data points within Q1-1.5*IQR and Q3 +1.5*IQR, respectively. The small open circles represent the individual data points. Fig. 3(A) shows that the normalized CT-based GTV_PT volume was generally larger than the MRI-based volume, both volumes were larger than tumor volumes on PET-CT.

