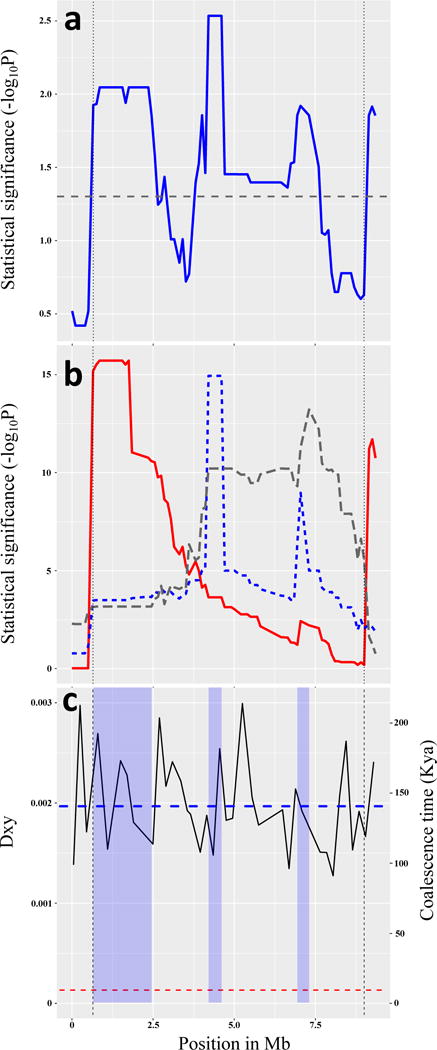
Figure 5. QTLs within the inversion.

A collinear cross shows that several QTLs in the inversion region influence phenology and development traits. Inversion breakpoints are indicated by vertical lines. (a) Multivariate QTL mapping finds several QTL peaks (blue line) exceeding the significance threshold (horizontal dashed line); N = 1,714 F4 individuals in 153 families. (b) Testing the hypothesis that three linked QTLs have different pleiotropic effects. Plots for three QTLs (left, center, and right, shown in solid red, dotted blue, and dashed gray, respectively) quantify evidence that a locus with different patterns of pleiotropy occurs at each peak. Discriminant Function Analysis was used to identify new composite trait axes defined at each peak, and evidence for these composite traits was mapped across the inversion region. The left and center QTLs show little overlap, suggesting different patterns of pleiotropy. (c) Comparison of molecular divergence and time to coalescence of the East and West genotypes in the collinear QTL mapping cross. The horizontal red dashed line at 8.8 Kya is the upper confidence interval for age of the inversion. The vertical axes show nucleotide divergence (Dxy, left axis), and coalescence time (Kya, right axis). The blue dashed line indicates the mean genome-wide values of Dxy and coalescence time between these East and West alleles. The horizontal axis shows position across the inversion region in Mb, beginning at marker Scaf26675_2450000. Vertical blue shading indicates the QTL regions, +/− logP > 1.6 confidence intervals, with 408 annotated genes in these QTL regions. Divergence (Dxy) between these genotypes was calculated in 200kb non-overlapping windows, and the coalescence time was estimated using T = Dxy/2μ, where μ is 7E-9 per site per generation. Mean Dxy in the three QTLs (left to right) are 0.00206, 0.00169 and 0.00186, corresponding to coalescent times of 147 kya, 121 kya and 132 kya, respectively. The mean Dxy in the whole inversion region is 0.00191, and the average coalescence time is 136 kya.
