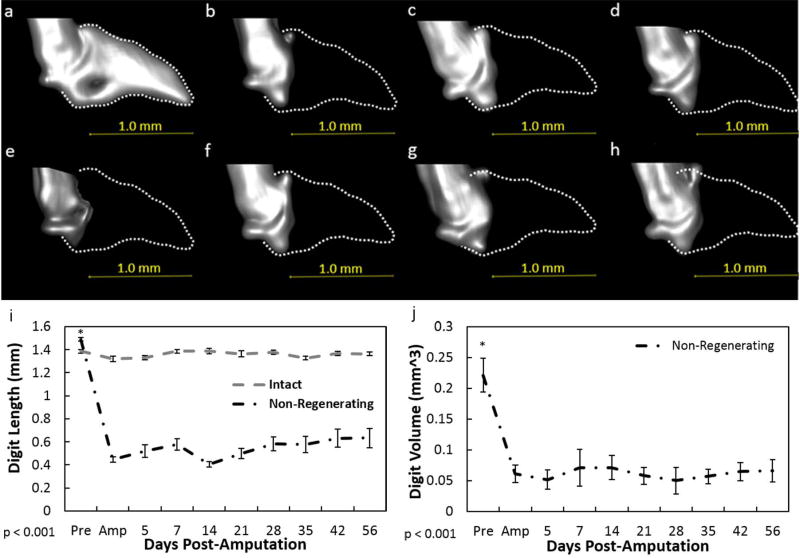
Figure 2. MicroCT analysis of the non-regenerating digit.
Representative longitudinal 3D reconstructed microCT images of the non-regenerating digit before amputation (a), day of amputation (b), 7(c), 14 (d), 21 (e), 28 (f), 35 (g), 42(h) post-amputation from one selected animal. The dotted lines (a–h) indicate the original P3 shape. A non-regenerative amputation resulted in a significant decrease in bone length (i), and volume (j) which was not recovered over time. Data for the intact digit included in the 3 graphs were not factored into the statistics and only used as a visual baseline marker. Beneath graphs (i–j), p value indicates ANOVA results. Data are expressed as mean ± S.E.M. *indicates significance between pre-amputation and all post-amputation days as a result from Tukey’s post-hoc pairwise comparisons where significance is p< 0.05.

