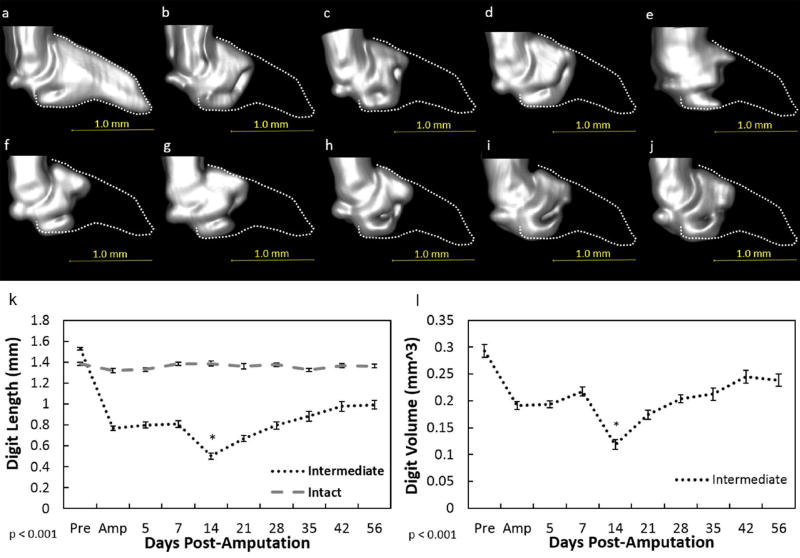
Figure 4. MicroCT analysis of the intermediate digit.
Representative 3D reconstructed microCT images of the intermediate digit before amputation (a), day of amputation (b), 5(c), 7 (d), 14 (e), 21 (f), 28 (g), 35 (h), 42 (i), and 56 (j) post-amputation. The dotted lines (a–j) indicate the original P3 shape before amputation. An intermediate amputation resulted in a reduction of bone length (k) and volume (l) on the day of amputation. However, a significant reduction in length and volume during histolysis was evident at day 14. Thereafter, length and volume increased to reach day of amputation values. Data for the intact digit included in the graph (k) were not factored into the statistics and only used as a visual baseline marker. Beneath graph, p value indicates ANOVA results. Data are expressed as mean ± S.E.M. *indicates significance at day 14 (k–l) between all other times. Significance is based on results from Tukey’s post-hoc pairwise comparisons where significance is p< 0.05. Pink color indicates P3.

