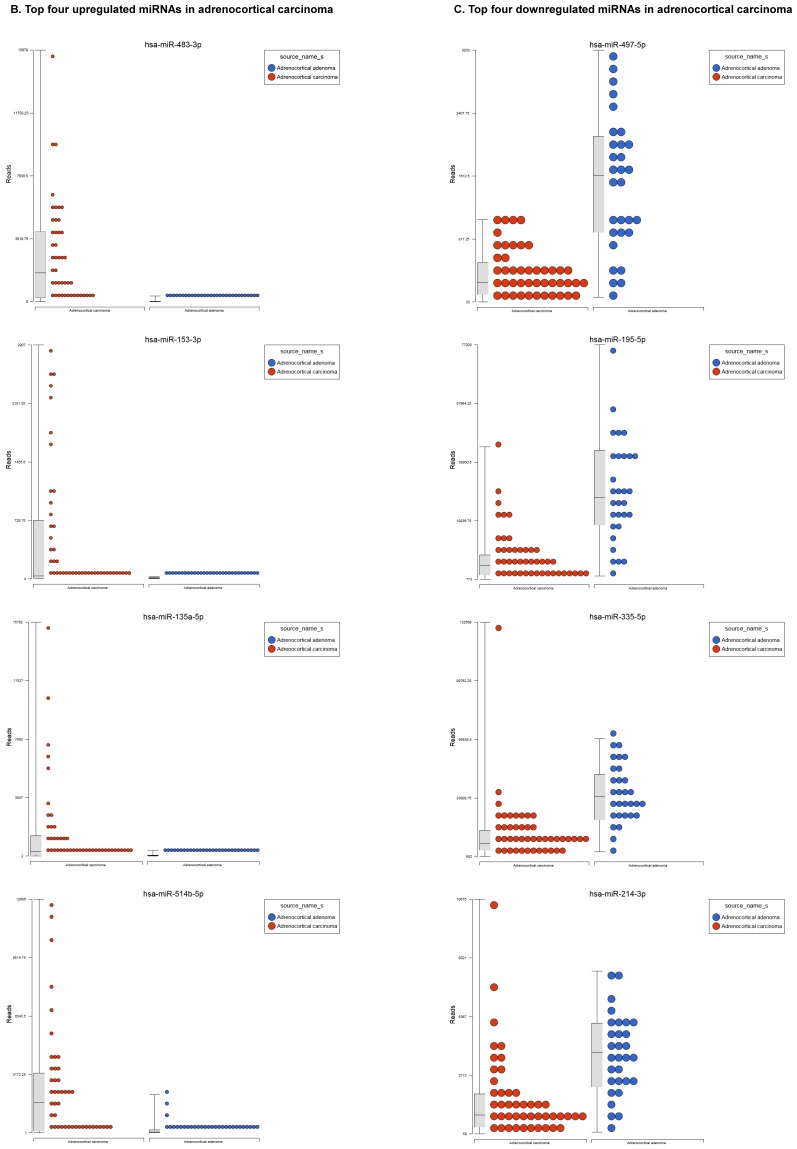
Figure 1.
Differential expression of miRNAs in ACC tissue samples: A heatmap view of differentially expressed miRNAs in adrenocortical carcinoma tissue samples (p<0.05; Figure 1A). Read counts of the top four statistically upregulated (Figure 1B) and downregulated (Figure 1C) miRNAs in ACC are shown by dot plots and box plots.


