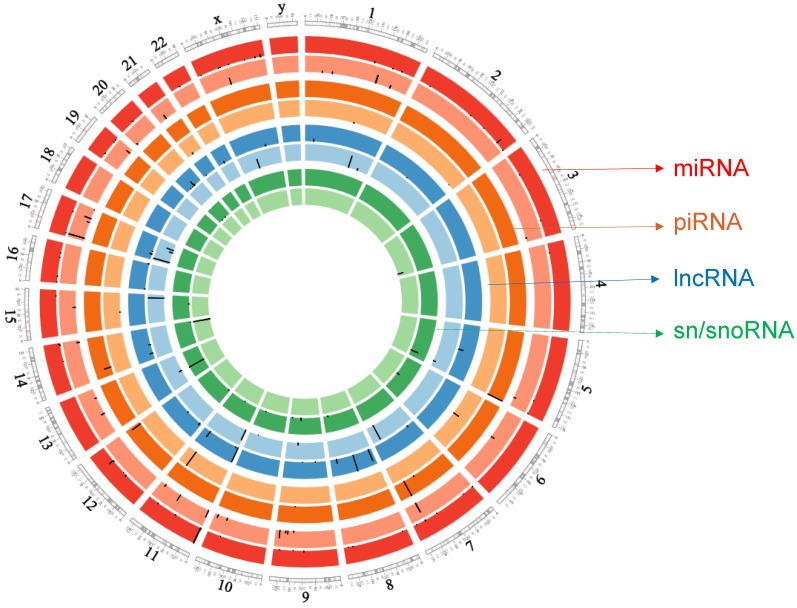
Figure 6.
Circos plot incorporating differential expressions of all small non-coding RNAs affected in ACC. Chromosome and bands are listed in chromosomal positions of small RNAs expression in ACC vs ACA tissue samples. Outermost ring is miRNA, then piRNA, lncRNAs, and sn/snoRNA with darker and lighter background colors representing upregulated and downregulated genes respectively.

