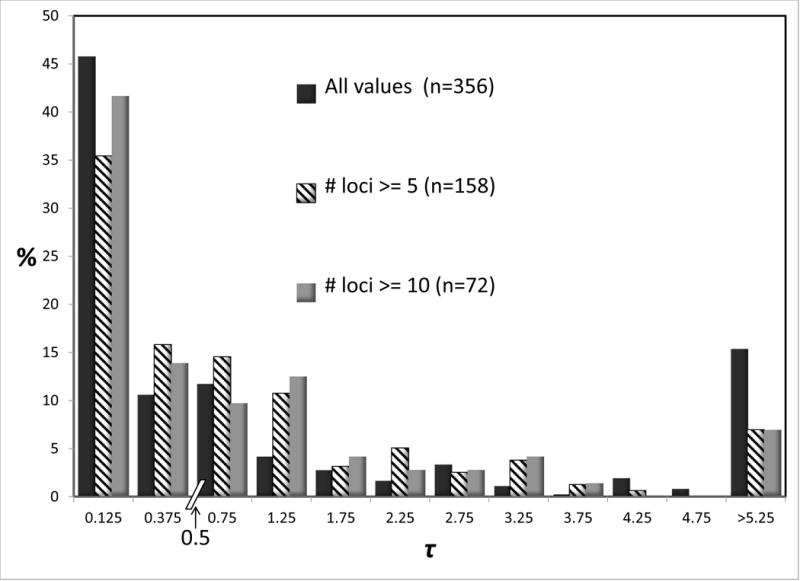
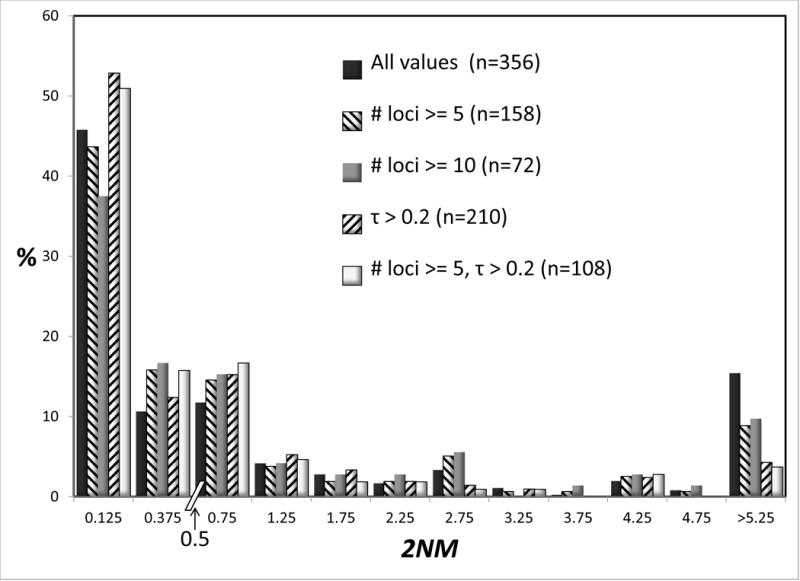
Figure 2.


Percentages of observations for 2NM (top) and τ (bottom). Because of varying sample sizes, percentages rather than actual counts are used to make comparisons easier. Sample sizes are given in parentheses. Each chart has two bins, each of width 0.25, for values below 0.5. Above 0.5 bins have a width of 0.5. Values are shown for all of the data, and when only a subset of studies are included, as described in the legend.
