
Figure 4.
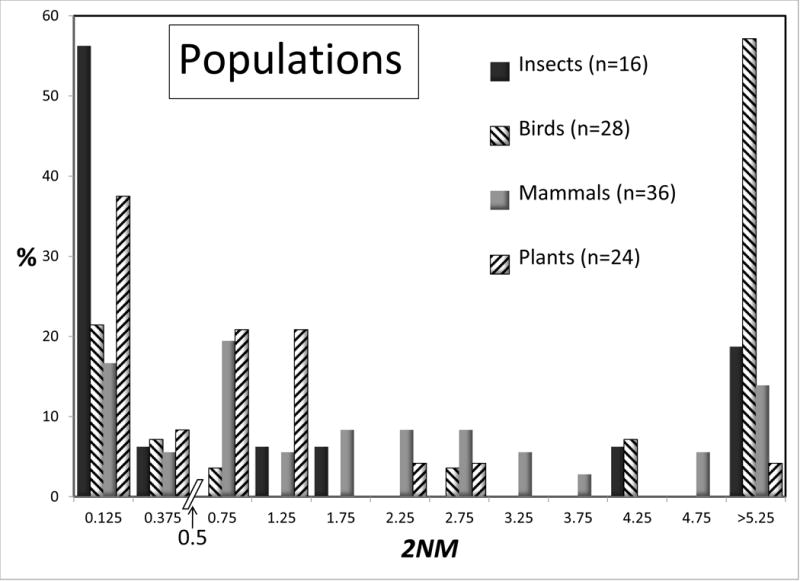
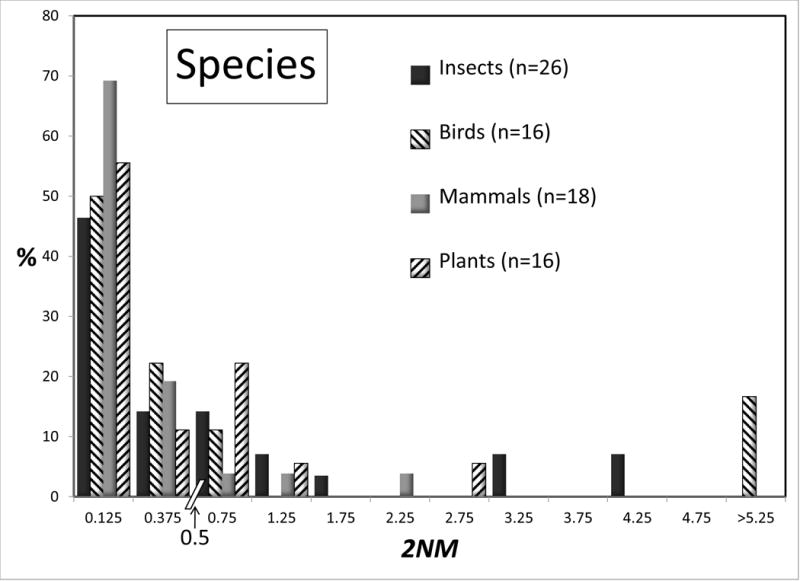
Percentages of observations for 2NM for species (top) and populations (bottom) for different groups of organisms. All groups with 15 or more observations are shown. See legend to Figure 2 for additional explanation.
Official websites use .gov
A
.gov website belongs to an official
government organization in the United States.
Secure .gov websites use HTTPS
A lock (
) or https:// means you've safely
connected to the .gov website. Share sensitive
information only on official, secure websites.
Percentages of observations for 2NM for species (top) and populations (bottom) for different groups of organisms. All groups with 15 or more observations are shown. See legend to Figure 2 for additional explanation.