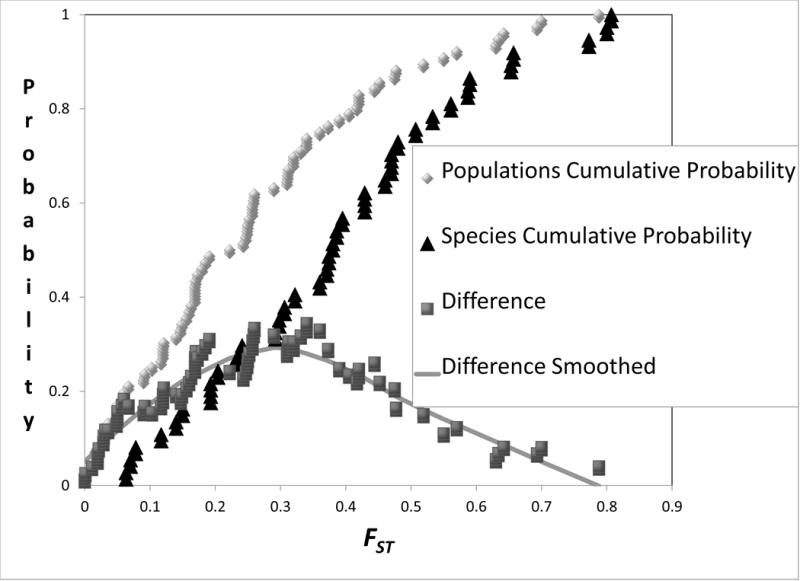
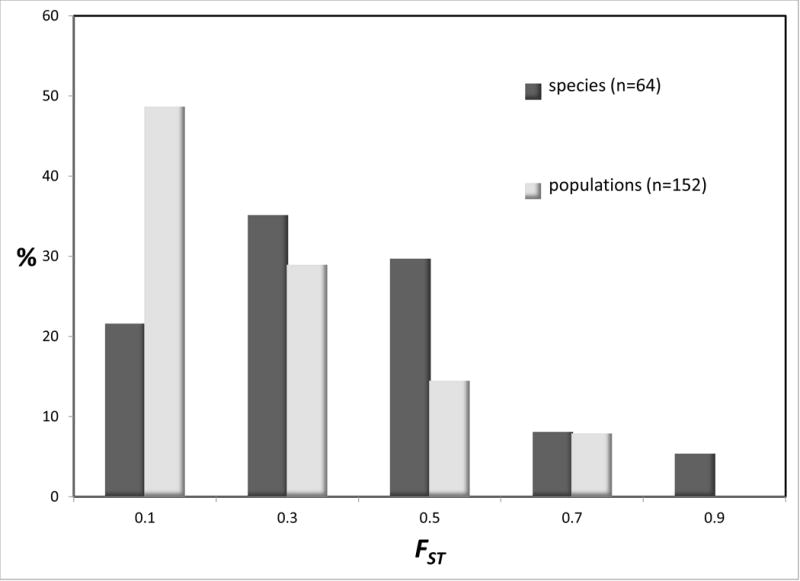
Figure 6.


Histograms (top) and cumulative distributions (bottom) for FST. For the histograms (top) values shown are the percentages of observations for FST for species and populations. For the cumulative distributions (bottom) values are shown together with the difference between the two. To determine the difference, each point in the cumulative distribution for populations was paired with the value from the cumulative difference in species that has the closest corresponding FST value. A smoothed curve was added for the difference using locally weighted scatterplot smoothing (Cleveland and Devlin 1988).
