Figure 7.


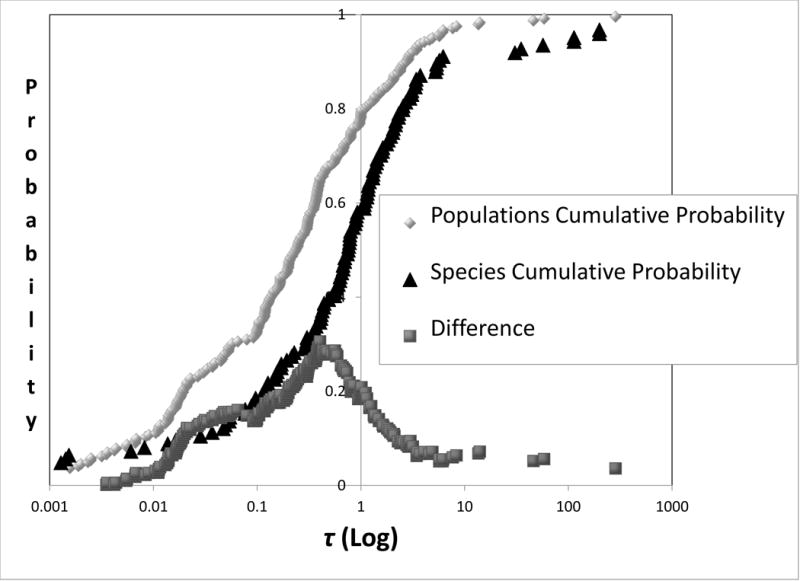
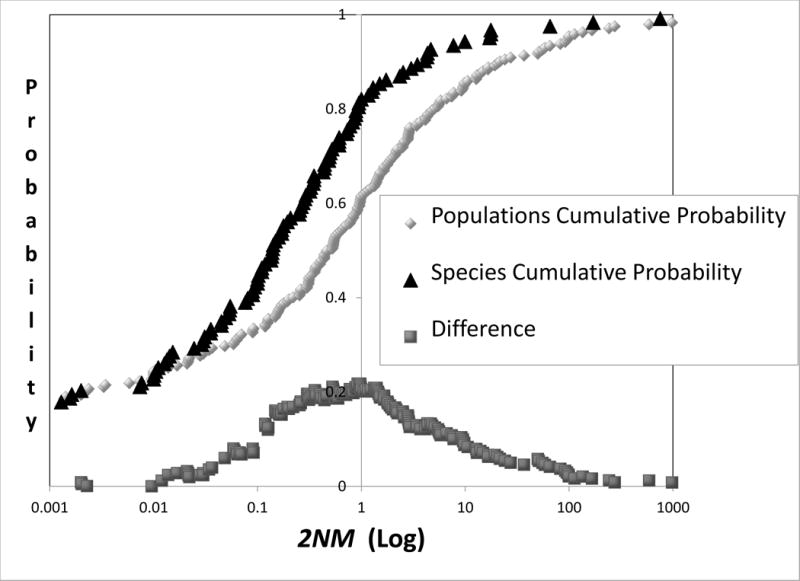
Cumulative distributions for 2NM (top) and τ (bottom). Curves are shown for both populations and species and for the vertical distance between the two. The difference points were obtained by as described in the legend for Figure 6.


Cumulative distributions for 2NM (top) and τ (bottom). Curves are shown for both populations and species and for the vertical distance between the two. The difference points were obtained by as described in the legend for Figure 6.