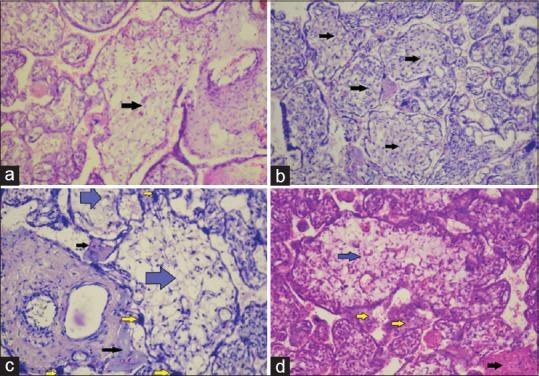
Figure 1.

Villous immaturity. (a) Villous immaturity in mild hyperglycemic placenta (marked by arrow) (H and E, ×400). (b) Villous immaturity in gestational diabetic placenta (marked by arrows) (H and E, ×400). (c and d) Villous immaturity in overt diabetic placenta (marked by blue arrows), syncytial knots (marked by yellow arrows) and fibrinoid substance deposition (marked by black arrows) (H and E, ×400)
